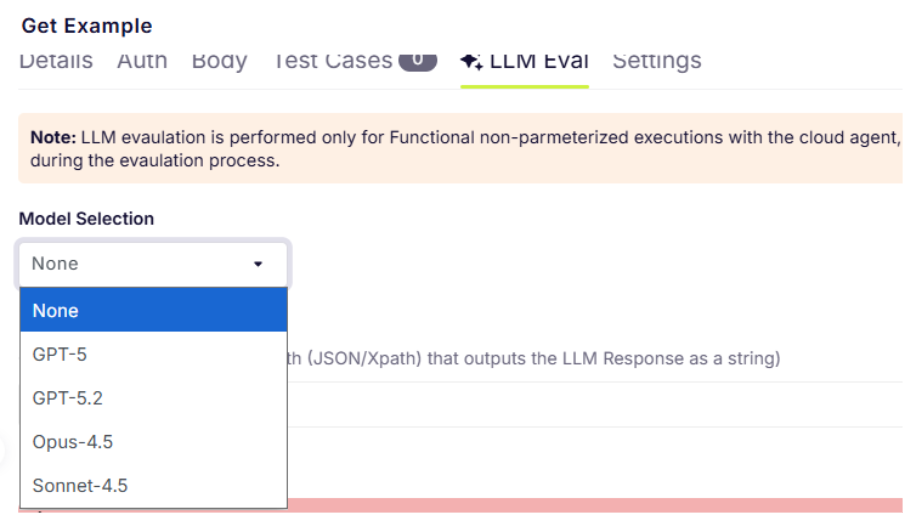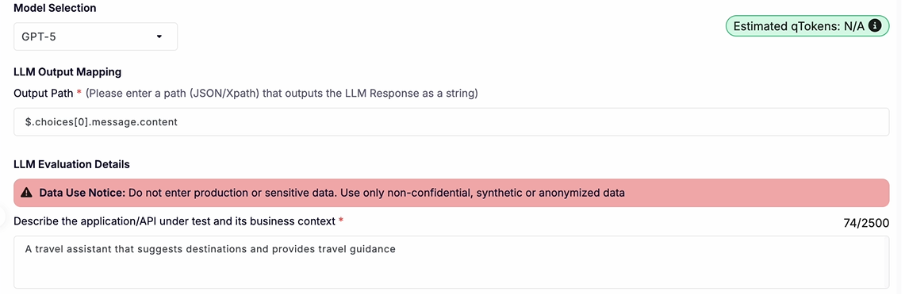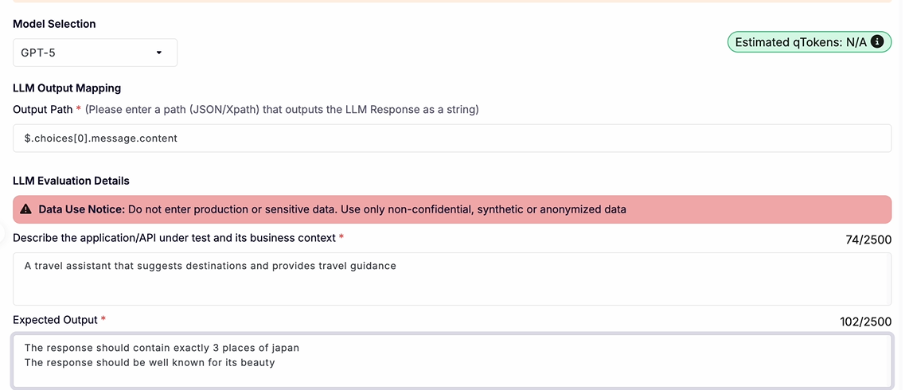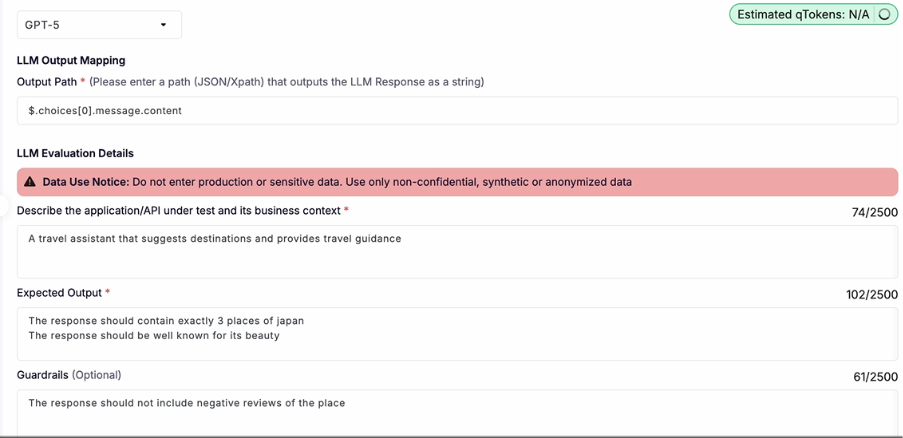
As part of the evolving qAPI platform, we’re bringing you qTokens which will serve as the consumption model behind your advanced testing and evaluation workflows. Whether you’re evaluating LLM outputs or running large-scale end-to-end API performance tests, qTokens will now be used to power the compute and infrastructure required behind each operation. 

qTokens is a tokenized system to simplify usage across the platform by giving teams a transparent way to track and manage resource consumption while scaling their testing needs efficiently. 

Using qTokens for LLM Evaluation 

The new feature from qAPI: LLM Evaluator uses AI models to automatically assess the quality, correctness, and reliability of your API and LLM responses. Each time an evaluation is run, qTokens are consumed based on the size, complexity, and computational requirements of the request. 

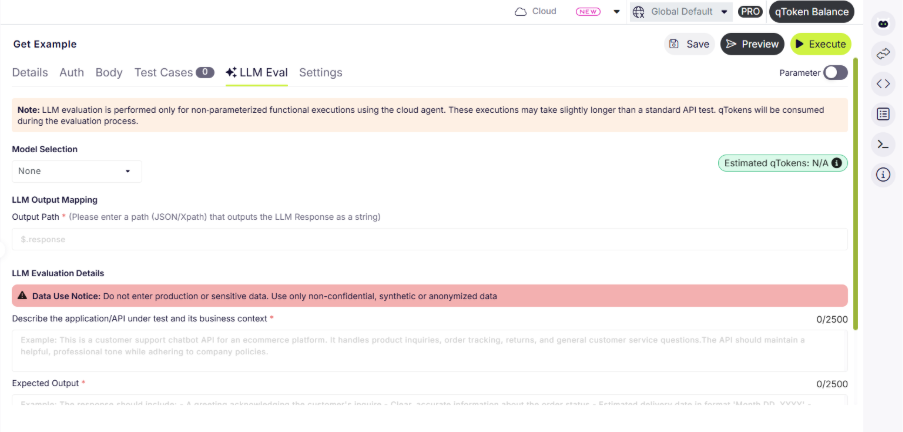
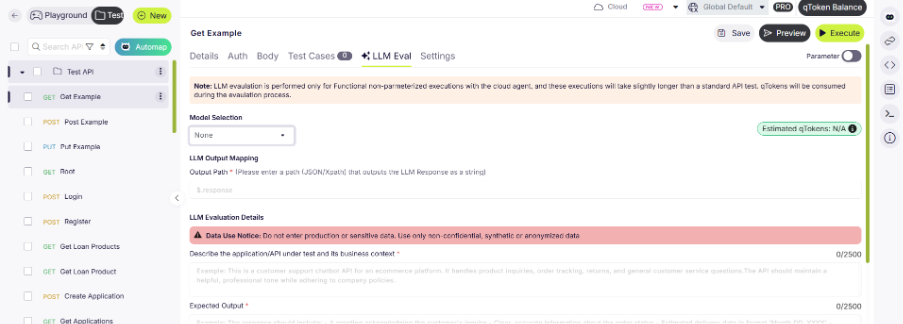
To use the LLM Evaluator, all you have to do is navigate to the Evaluator tab within the qAPI dashboard, select the LLM tool you’ve built to test, and configure the evaluation criteria. These criteria may include factors such as accuracy, latency, schema compliance, semantic relevance, and contextual appropriateness depending on the testing objective. 

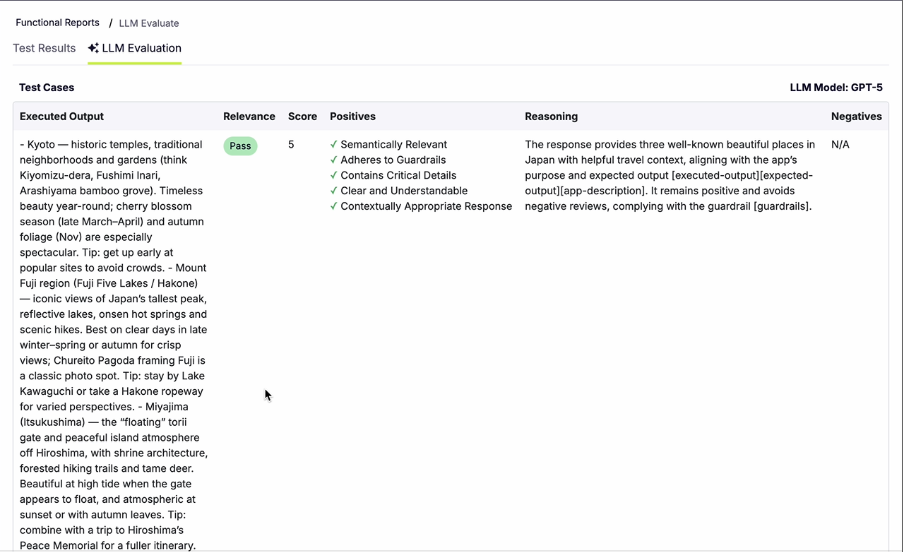
Once the evaluation is submitted, qAPI processes the request and deducts the corresponding qTokens automatically. After completion, users receive a detailed evaluation report containing AI-generated insights, scoring metrics, and pass/fail outcomes to help identify response quality issues before deployment. 

Because LLM evaluations require substantial computational resources, the number of evaluations available within a given token balance is determined by the average compute cost per run. This allows teams to scale their evaluation processes while maintaining visibility into usage. You can use it to test Functional tests, performance tests and even workflow tests 

During these tests, qTokens power Virtual Users (VUs)—simulated concurrent users that generate traffic against your APIs to test scalability, throughput, and system stability under load. 

To begin a performance test, users can access the Performance Testing section of the qAPI dashboard and define their desired test scenario. This includes selecting endpoints, configuring ramp-up profiles, setting test durations, and establishing assertion thresholds for acceptable performance. 

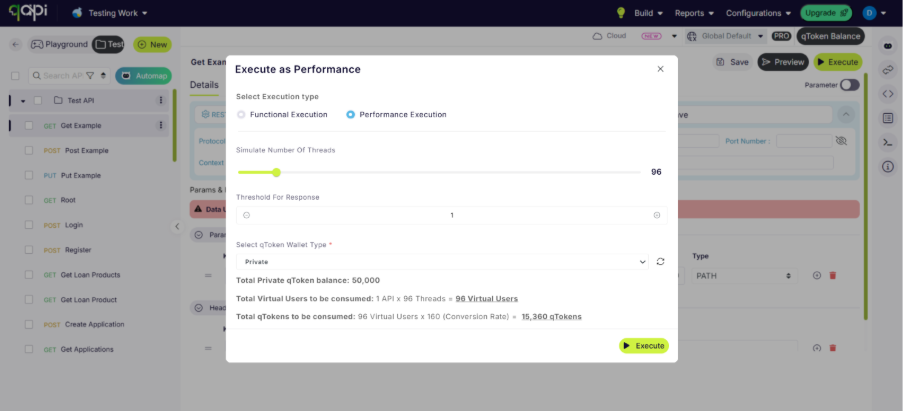
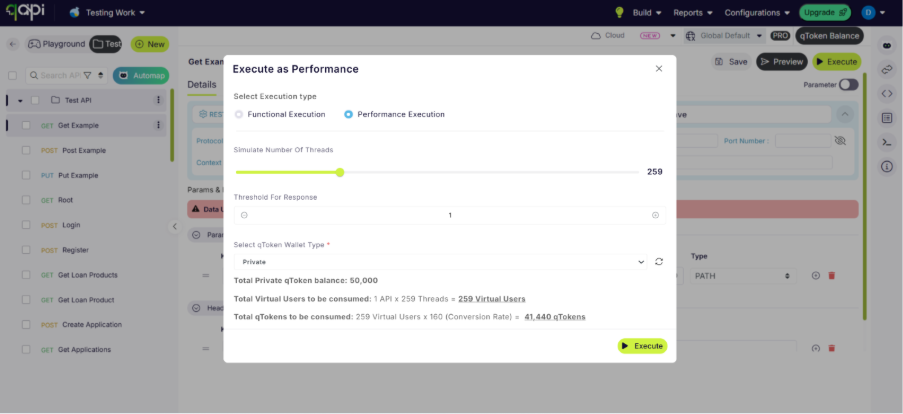
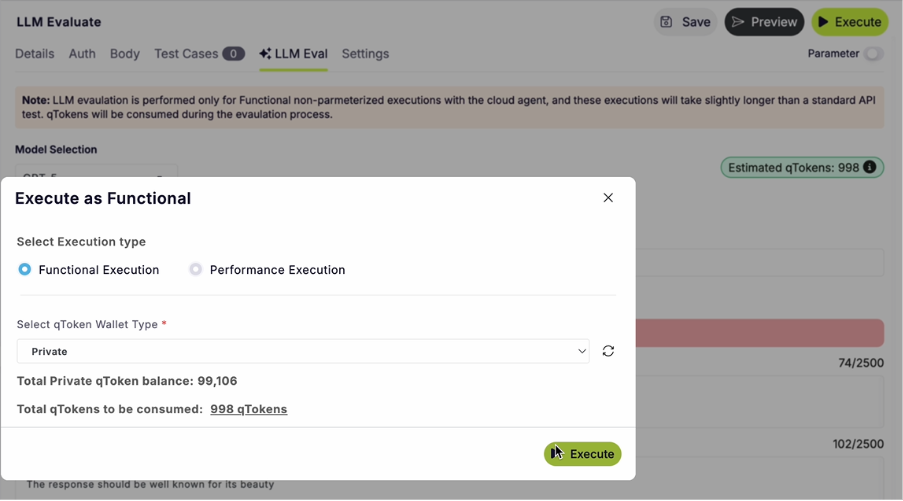
If you can see in both images the tokens will be utilized based on the parameters you select. 

Once configured, teams can allocate the required number of virtual users based on their testing goals. qAPI will display the expected qToken consumption before the test begins, allowing users to understand the impact of the load configuration before execution. 

As the test runs, teams can monitor real-time performance metrics including throughput, response times, and error rates. Once completed, qAPI generates a detailed performance report to support optimization and troubleshooting efforts. 

This capability enables organizations to simulate real-world traffic conditions and validate API reliability before pushing updates into production. 

Managing Your qToken Balance 

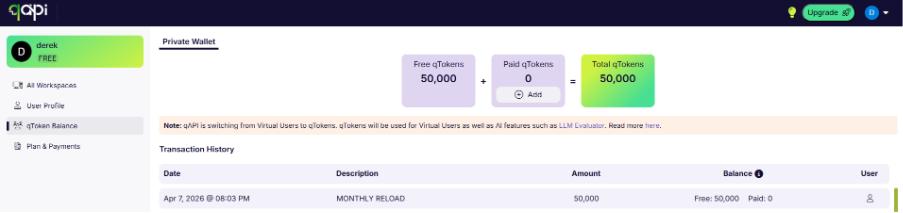
Your qToken balance can be monitored directly from the qAPI dashboard, giving full visibility into consumption across all modules and services. Teams can track usage patterns, monitor token burn rates by feature, and configure alerts to notify them when balances are running low. 

This centralized tracking helps engineering teams plan testing cycles more effectively while maintaining control over resource utilization across evaluation and performance workflows. 

In case you run out of tokens’ there’s a simple way to buy as many tokens as you need. All you need do is select the number of tokens you want complete the payment process, and the testing can begin. 

Who qTokens Are For 

qTokens are designed for: 

• QA and test engineers validating API correctness and response quality 

• AI and LLM teams evaluating model outputs before production release 

• Platform and infrastructure teams stress-testing APIs under real-world traffic 

• Engineering teams running functional, performance, and workflow tests as part of CI/CD 

No matter the role, qTokens will ensure that every test is powered appropriately and measured consistently. 

How qToken Usage Is Calculated 

qToken consumption is based on the computational resources required to complete a test or evaluation. Usage may vary depending on:

• Request size and payload complexity

• Type of test (LLM evaluation, functional test, performance test, or workflow test)

• Test duration and execution time

• Number of concurrent virtual users (VUs) • Underlying model or infrastructure requirements 

    This approach ensures that lightweight tests remain efficient, while more demanding workloads scale proportionally and predictably. 

    Getting Started 

    Getting started with qTokens is simple: sign in to your qAPI account, open your test suite from the dashboard, and begin configuring your evaluation or performance test workflows. Your qToken balance updates in real time as jobs run, giving you clear visibility into usage and making rapid iteration effortless. 

    With the qAPI rebrand now officially live, qTokens sit at the core of what comes next—powering a smarter, more scalable generation of API testing, evaluation, and performance analysis. This marks just the beginning of a more unified, intelligent platform built to grow with your needs. 

    FAQ

    qTokens in private wallet can be used across all projects, but it can be only used by user themselves. Shared wallet is available for shared workspaces which can be used by the users in that workspace. This will allows teams to dynamically reallocate usage based on priority—while still tracking consumption by feature and workflow from the dashboard.

    Yes. For performance and workflow tests, qAPI shows an estimated qToken consumption before execution based on your configuration (VUs, duration, ramp-up, etc.). For LLM evaluations, exact consumption can vary depending on response size and complexity, but qAPI provides visibility into historical averages and post-run usage, allowing teams to confidently forecast future runs. This balance ensures accuracy where compute variability exists without hiding usage details.

    Since the qToken deduction happens before execution, and the execution only runs if you have sufficient balance.

    Currently, qTokens are managed at the account level, but usage is fully visible by feature and workflow.

    qTokens are well‑suited for CI/CD environments because: There are no hard execution caps Usage scales naturally with pipeline load Consumption reflects actual test runtime and complexity Teams running automated evaluations or load tests can rely on qTokens to support both low‑frequency validation and high‑frequency pipeline executions without reconfiguring limits.

    No. Purchased qTokens do not expire. This gives teams the flexibility to: Stock up ahead of major testing cycles Scale down temporarily without loss Resume heavy testing when needed Tokens will remain in your wallet until consumed.

    Not necessarily. While performance testing with high concurrency can consume tokens quickly, large-scale LLM evaluations (especially those involving long responses or multi-criteria scoring) can also be significant consumers. qTokens intentionally treat both workloads equally—based on compute—not test type—so teams can prioritize where resources truly matter.

    We shipped four major upgrades this month that directly solve the hardest problems our power users keep running into. Here’s what’s new and why it matters to you right now. 

    1. Secure Pipelines: Token-Based Authentication Is Live! 

    Integrating API testing platforms into CI/CD pipelines or external developer tools gave users both security and reliability issues. Using standard user login sessions for automated workflows is fragile—sessions expire frequently, leading to unexpected build failures. On top of that, exposing real user credentials to third-party tools creates serious security risks. 

    What we built   

    Full User Token + API Key authentication across every qAPI endpoint — battle-tested in staging and now rolled out to production.

    •  Zero Pipeline Downtime: Use dedicated API keys for machine-to-machine communication. No more broken builds due to session timeouts.

    •  Enterprise Security: Safely connect qAPI to your favorite tools and scripts without ever exposing user passwords.

    •  Effortless Automation: Generate simple, secure tokens to kickstart headless testing workflows instantly 

    2. AI-Powered Testing: Semantic LLM Evaluations 

    Testing GenAI endpoints with exact-match assertions is officially dead. 

    Most API testing hinges on exact-match rules—specific strings, regex patterns, fixed JSON paths. But in a world flooded with GenAI and NLP outputs, responses are increasingly variable. A perfectly valid answer might be worded completely differently each time. Strict assertion logic flags these as failures, creating a pile of false negatives and dragging QA teams into tedious manual review. 

    Dynamic responses change phrasing every call, yet mean the same thing → traditional tests scream false failures → you waste hours manually reviewing “broken” tests. 

    What we built   

    We built a brand-new Semantic Evaluation test type powered by an LLM-as-a-judge model, right inside your API test cases. Instead of checking character-by-character, it assesses whether the meaning of a response aligns with what you expect.  

    You only have to share the context, your expected outcome, and optional safety rails. qAPI pulls the live response output (from JSON/XML paths or a custom override) and feeds it to an LLM that scores it against your criteria. 

    What you get 

    •  Validate What Was Previously Impossible: Dynamic text, conversational AI outputs, and generated content can all be tested reliably—no more brittle keyword guards.

    •  Rich, Contextual Feedback: Your execution panels now include a dedicated Semantic Evaluator tab. It delivers a relevance score and a detailed judge commentary that breaks down what worked and what didn’t in the response. 

    •  Configurable Pass/Fail Logic: Define your own thresholds. The AI judge will classify each result as a Pass, Fail, or flag it for human Review based on the boundaries you set.

    •  Plug Right Into Existing Workflows: Design sophisticated AI-backed assertions with very little setup and attach them directly to your current test suites. 

      You can finally test chatbots, LLM wrappers, search APIs, and content generation endpoints without constant test maintenance. 

      3.Full LLM Model Visibility in Execution Reports 

      Full LLM Model Visibility in Execution Reports
      Semantic Evaluations was supposed to give you the ability to let AI assess dynamic responses—but when you’re juggling multiple LLM providers or model versions across different test suites, your reports don’t tell you which model evaluated which test. That blind spot makes it hard to audit decisions, compare model performance across runs, or figure out why a particular evaluation seems off. 

      What We Did About It: 
      We upgraded the reporting engine to capture and surface the exact LLM model used for every semantic evaluation. We also cleaned up the result terminology so that AI-generated feedback, scores, and statuses are easier to interpret at a glance. 

      Why This Matters:

      •  End-to-End Traceability: Every evaluation now shows precisely which model did the judging—no more guesswork about what produced a given score.

      •  Sharper Root-Cause Analysis: Pinpoint whether an unreliable semantic test stems from the prompt, the actual API output, or the particular LLM version acting as the judge. 

      •  Cleaner, More Digestible Reports: Streamlined wording across summaries, scoring, and pass/fail indicators removes confusion and speeds up your review process. 

      4. Faster Previews, On-Time Schedules, and Flawless Wallet Sync 

       As testing volumes climb into the millions, the backend systems responsible for credit management, scheduling, and live previews start showing their age. You may have noticed occasional lag when rendering previews for large payloads, slight timing drifts on automated schedules during peak hours, or sync headaches when managing qToken wallets across a big team. 

      What We Did About It 
      We rebuilt the backend logic for three foundational qAPI components from the ground up: qToken wallet management, the execution scheduler, and the API preview engine. Older processing paths have been replaced with a modern, highly optimized architecture engineered for enterprise-scale throughput and reliability. 

      What You’ll Experience:

      •  Fast Previews: Complex payloads, custom headers, and AI evaluation previews now render almost instantly—no more staring at loading spinners. 

      •  Clockwork Scheduling: Automated test suites fire at precisely the scheduled moment. Backend queuing delays are eliminated, even during your busiest testing windows.

      •  Real-Time Wallet Accuracy: qToken balances and allocations sync instantly and securely across every user in your organization. Team-level resource management just became completely hands-off. 

      Our goal is to give you a platform that evolves alongside your needs—removing friction from critical workflows so your team can ship higher-quality software with greater velocity and confidence. 

      The best way to understand the impact? See it in action. 

      Log on to qapi.qyrus.com 

      All features above are live in production today. 

      The difference is night and day when you see it on your own APIs. 

      You’ve been handed a task. Maybe it’s “pick the best LLM for our product.” Maybe it’s “figure out why our AI responses are getting worse.” Maybe it’s “build a system that tells us when our model is failing before a customer notices.” 

      Whatever the task, you quickly run into the same problem: everyone has an soft corner for some, the benchmarks look cooked, and “just try GPT-5/Gemini or etc.” it’s not an engineering decision. 

      All this started when GPTs actually was released to public and we are still trying to play catch up on the pace these tools and their capabilities are evolving.  

      So where do you go from here? 

      Let’s say the existing tools are no longer enough. Maybe the reports aren’t accurate, the research quality is inconsistent, or the outputs simply don’t meet your expectations. You decide to build your own solution using platforms like Replit, Emergent, or custom infrastructure.  

      This guide is for the people who have to make real decisions — engineers building production systems, architects choosing vendors, business people building interactive chatbots, researchers building eval pipelines from scratch.  

      We’ll start with what the models actually are, walk through how to compare them honestly, go deep on methods and math, and end with the exact tools you need to build something that works. 

      What is an LLM? 

      Large language models (LLMs) are being developed by using Artificial Intelligence to make them capable of understanding and generating natural human language so it can understand prompts and generate human-like responses. 

      What is an LLM?

      How Does an LLM Work? 

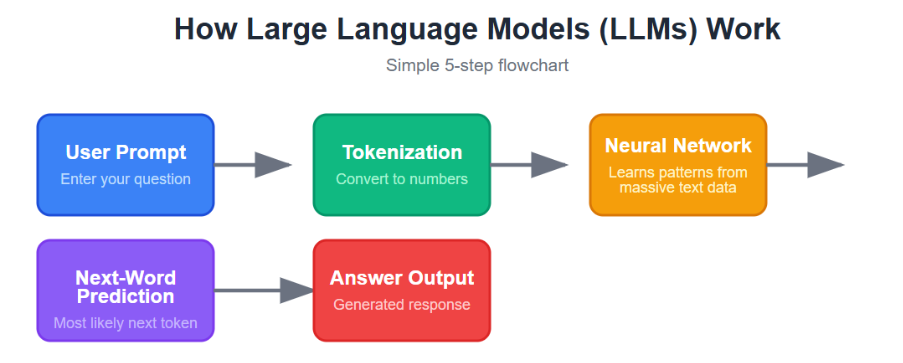
      LLM is a computer program that is trained through large data sets, from where it learns and understands context. And with the power of AI it puts it all together and gives us the output. It works by predicting and learning based on the patterns it learned during training. 

      An LLM works by first breaking your text into smaller pieces called tokens, then turning those tokens into numbers the model can process. It uses a transformer architecture with attention to understand how words and phrases relate to each other, including context and meaning, and then predicts the next token one step at a time to create a response. 

      In simple terms, it is like a very advanced autocomplete that reads the whole sentence, understands the relationships between words, and writes the most likely answer in a natural way. 

      How to Evaluate any LLM? 

      Before you can evaluate anything, you need to understand what you’re evaluating. “Best LLM” is a question that can only be answered by finishing the sentence: best for what. 

      How to Evaluate any LLM?

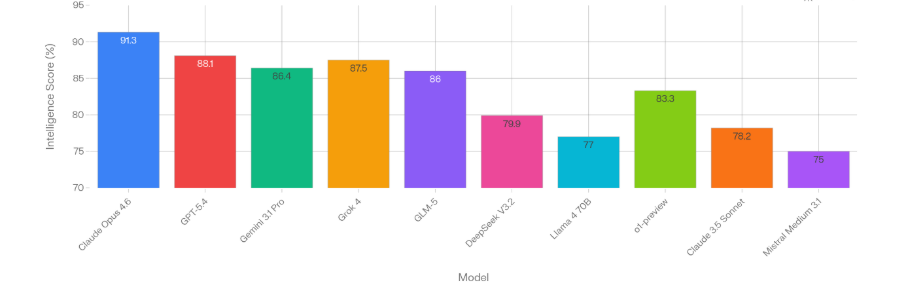
      If you can see in the image above, the LLMs have been mapped for intelligence, but is that useful for your usecase?

      Model Best For
      Claude Opus 4.6 Reasoning, coding
      GPT-5.4 General production
      Grok 4 Math, agentic tasks
      Gemini 3.1 Pro Multimodal, value
      GLM-5 Open-source leader
      o1-preview Chain-of-thought
      Claude 3.5 Sonnet Long context
      DeepSeek V3.2 Coding efficiency
      Llama 4 70B Fine-tuning
      Mistral Medium 3.1 Cost-effective

       To an extent, yes—but what if you’ve used one of these tools to develop your own LLM? 

       How will you evaluate or check that it works as expected? How do you identify its limitations, edge cases, or failure points before it reaches users? These tools are just the starting point, and while there are many available to help build models, building is only half the equation. 

      The real challenge begins after development: validation.  

      An LLM might perform well in a demo environment yet fail when exposed to some random prompts, domain-specific questions, or large-scale production traffic. Without structured evaluation, teams are left relying on subjective testing. That approach does not scale, nor does it provide measurable confidence in model quality. 

      This is why LLM evaluation has become a critical part of the development lifecycle. You and your teams need frameworks to benchmark outputs against expected results, score responses for relevance and accuracy, compare prompt or model versions, and continuously monitor regressions over time.  

      Much like software testing transformed application development, systematic LLM evaluation ensures that AI systems are not just functional—but reliable, measurable, and production-ready. 

      What an LLM Evaluator Actually Does 

      An LLM evaluator is just like your exam supervisor — a person, a script, another model, or a combination — that takes an LLM’s output and validates it through a preset or custom made parameters about its quality. 

      That’s a deliberately broad definition, because the field has fractured into several distinct evaluation paradigms and each is appropriate for different contexts. 

      LLM-as-judge is the approach that’s taken over the field in the last two years. You use a capable model — usually GPT-5 or Claude — to score another model’s outputs on a scale. You can evaluate, without paying for human annotators, and you can evaluate open-ended outputs that would break any reference-based metric.  

      The catch is judge bias: LLM judges are known to favor responses over concise ones, to prefer the first response shown in a pairwise comparison, and to represent stylistic preferences that may not match human preferences.  

      Mitigation: use multiple judges, randomize presentation order, and calibrate against human judgments to estimate your bias. 

      Execution-based evaluation is the gold standard for code and structured output tasks. You run the generated code against a test suite and count whether the tests pass. No subjectivity, no rubric — it either works or it doesn’t. HumanEval and MBPP (the standard code benchmarks) use this approach. SWE-bench goes further and evaluates whether a model can actually close real GitHub issues, which is a much harder test. 

      In practice, a mature evaluation system uses all of these. Automated metrics run on every deployment for regression detection. LLM-as-judge handles the open-ended quality signal. Execution-based evaluation handles any tasks where the output can be mechanically verified. Human evaluation happens on a sample basis to keep the automated signals calibrated. 

      How to Actually Compare LLMs 

      Most LLM comparisons fail for the same reason: they use someone else’s benchmark results to make a decision about their own use case. 

      The benchmarks are real and they’re useful, but they’re measuring performance on a distribution of tasks that may have nothing to do with what you’re building. A model that leads on MMLU (a knowledge breadth benchmark spanning 57 academic subjects) might perform mediocre on your customer support tickets. A model that’s mediocre on HumanEval (Python coding) might be excellent at the specific SQL generation your team needs. 

      Here’s how to evaluate LLM the effective way. 

      Step one: Create and deploy your LLM.  

      Once your LLM is deployed, the next step is to configure your output XPath/JSON mapping.  

      You’ll find the LLM output wherever your model returns its response after inference—typically in one of these places depending on how you’re deploying/testing it: 

      If your LLM is deployed behind an API, the output is usually inside the JSON response. 

      Example: 

      {   “id”: “chatcmpl-123”,   “choices”: [     {       “message”: {         “content”: “The capital of France is Paris.”       }     }   ] } 

      In this case your output JSON path would be: 

      $.choices[0].message.content 

      If you’re using: 

      •  OpenAI Playground  

      •  Azure AI Studio 

      •  Hugging Face 

      •  Internal LLM dashboards  

      The raw response/output panel will show exactly what the model returns. 

      In case If you are using frameworks like: 

      •  LangChain  

      •  LlamaIndex  

      •  Haystack  

      The output may be wrapped in another object, e.g.: 

      {   “result”: {     “answer”: “Paris”   } } 

      Path becomes: 

      $.result.answer 


      This defines where the required values are extracted from the model’s response so evaluating systems can process them correctly. If the mapping is incorrect, even valid outputs can break integrations. So we suggest that teams should also standardize response formatting, validate schema structure, and handle incomplete or malformed outputs before moving forward.  

      Step two: Define your evaluation criteria.  

      What does “good” mean for your specific task? For a customer support use case, you might care about: accuracy, consistency, reasoning and edge-case handling.  

      Test prompts should be validated against expected outputs, repeated runs should be checked for response drift, and failure scenarios should be tested to ensure stable behavior under unexpected input. In addition, teams should implement monitoring, prompt/model versioning, confidence thresholds, and rollback mechanisms to maintain reliability after deployment. 

      Step three: Generate outputs blindly.  

      Run each model on your full prompt set without any model-identifying information in the evaluation process. If you’re using LLM evaluator, you should run tests with different models. This is harder to enforce than it sounds but it makes it easy to compare differences between different models. 

      Step four: Score pairwise.  

      For each prompt, compare outputs reports for all. Which is better, or is it a tie? Pairwise comparison is more reliable than absolute scoring because it’s easier to judge relative quality than to assign a consistent score on an abstract 1–5 scale. Aggregate your pairwise results into a win rate or an Elo score (the same rating system used in competitive chess). 

      Step five: Segment your analysis.  

      We recommend that you don’t just look at overall win rate. Break your results down by task category — if Model A wins on 70% of reasoning tasks but loses on 60% of extraction tasks, and your product is mostly extraction, the overall win rate is misleading. Find the model that wins on the tasks that matter most to you. 

      The Evaluation Method That Actually Works 

      qAPI has launched LLM evaluator feature here’s how you can use it to evaluate your LLM. 

      Step 1: once you’ve logged into the application, open your test suite. 

      Step 2: Click on LLM Eval tab.

      Click on LLM Eval tab.

      Step 3: select the model you want to evaluate with 

      select the model you want to evaluate with

      Step 4: Give context 

      Describe the application / API under test and its business context 

      You can: 

      1. State what the application or API is 
        1. What kind of system it is (e.g., chatbot API, order management API, payment API). 
      2. Mention the business or product it supports 
        1. Industry or platform (e‑commerce, banking, healthcare, SaaS, etc.). 
      3. Explain the main purpose 
        1. What problem it solves or what functionality it provides. 
      4. Describe who uses it 
        1. End users, customers, internal teams, partners, etc. 
      5. Add any important behavior or tone expectations (if applicable) 
        1. Example: professional, friendly, policy‑compliant responses. 

      Example structure: 

      This API is used for … It supports the business function of … The primary users are … It is expected to behave in a … manner. 

      Or you can just put a one liner like we did. 

      Describe the application / API under test and its business context

      Step 5: Define Expected Output 

      Again, you can: 

      1. Describe what a successful response should include 
      2. Give the order or structure of the response 
        1. Greeting → main information → additional details → closing (if applicable). 
      3. Add accuracy requirements 
        1. Data must be correct, complete, and relevant. 
      4. Mention formatting rules 
        1. Date formats, field names, response structure, etc. 
      5. Include tone or clarity expectations 
        1. Clear, concise, professional, helpful. 

      Example : 

      LLM output

      Step 6: Add some Rules/Guardrails (Optional) 

      Add some Rules/Guardrails (

      Step 7: Click on save and hit on execute. 

      Step 7: Click on save and hit on execute.

      Select the functional execution type, select the token wallet type. And click on execute. 

      Step 8: Evaluate results. 

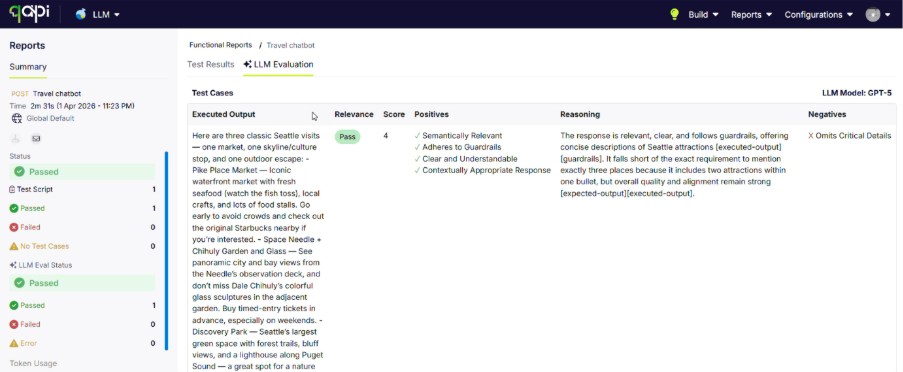
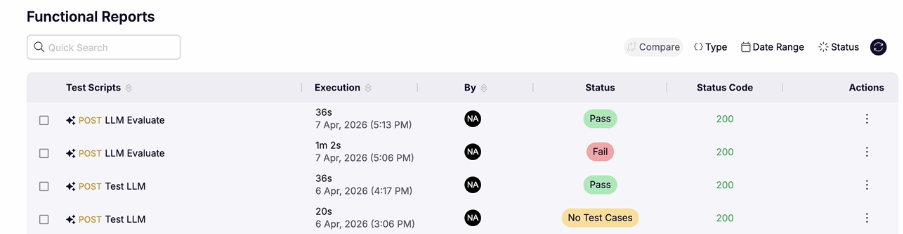
      Once the evaluation is complete, you’ll find it in the reports tab as shown below. Click on the test script to get the detailed report. 

      LLM Result

      Once the report is open click the LLM evaluation tab.

      LLM evaluation tab.

      As you can see here the report shows if the LLM passed the tests, and also rates it form 1-5(5 being the highest) and also lists down the positives it was tested against. 

      Now you can run the process again with different model and then compare the evaluation results for your LLM. 

      In Closing 

      Most teams evaluate whether their LLM answers are correct. Almost no teams evaluate whether their LLM answers are confidently wrong in a way that causes harm. 

      Most teams today evaluate LLMs in the simplest way possible: “Was the answer correct?” 

      But that’s no longer enough. 

      The real risk isn’t just when a model gets something wrong — it’s when it gives a confident, polished, believable answer that is wrong, and traditional evaluation tools fail to catch it. 

      Most current LLM evaluation platforms are still lagging behind because they focus heavily on binary scoring: 

      1. Right vs wrong  
      2. Pass vs fail  
      3. Keyword match vs no match  

      What they often miss is quality beyond correctness. 

      That’s where qAPI’s LLM Evaluator changes the game. 

      Instead of limiting evaluation to surface-level correctness, qAPI helps teams assess whether responses are: 

      1. Semantically relevant to the prompt  
      2. Adherent to defined guardrails and policies  
      3. Inclusive of critical required details  
      4. Clear and understandable for end users  
      5. Contextually appropriate to the intended use case 

      Build your LLM and get it evaluated on qAPI  

      API testing is the process of verifying that your APIs work the way they are supposed to — every time they are called, under normal and edge-case conditions.  

      This guide covers automated API testing across unit, integration, regression, and contract testing scenarios — so whether you are working with a single service or a distributed microservices architecture, you will find a practical approach that fits. 

      However, the problem is that “basic” API testing in many teams is still manual, inconsistent, or done only right before release. Someone clicks through a few requests in Postman, everything looks fine, and the feature ships. Two weeks later, a small response change — like a field returning null instead of a string — breaks the frontend, triggers user complaints, and creates an avoidable production incident. 

      The difference between teams that catch these issues early and teams that debug them in production comes down to one thing: structured, automated API testing done properly. 

      A reliable approach does not rely on memory or manual checks. It validates: 

      •  Request and response structure 

      •  Status codes and error handling 

      •  Required and optional fields 

      •  Edge cases and negative scenarios 

      •  Contract compatibility between services 

      In other words, it runs the same meaningful checks every time code changes — not just once before a merge. 

      This guide focuses on a practical, modern approach to automated API testing. No unnecessary theory. No overcomplicated frameworks. Just what you actually need to prevent APIs from quietly breaking. 

      If your goal is to stop avoidable API failures and ship changes with confidence, this guide will show you how. 

      What Automated API Testing Actually Means 

      Let’s get something out of the way first. Automated API testing is not the same as clicking “Send” in a GUI tool a hundred times. It means you have a test suite — a set of defined checks — that runs on its own, without a human babysitting it, and tells you with confidence whether your API is behaving correctly. 

      Think of it like a smoke detector. You don’t manually sniff the air every morning to check for fire. You install a detector that does it for you, and you only hear from it when something is actually wrong.  

      Automated API testing is the smoke detector for your backend — and just as a smoke detector connects to a broader home security system, automated testing connects to broader API monitoring practices that watch your APIs continuously in production, not just at release time. 

      What it covers: 

      Request validation — Are you sending the right data, in the right format, to the right endpoint? A request with a malformed body or a missing required header should fail your test before it ever hits production. 

      Response validation — When the API responds, is the shape of that response what you expect? Does it have the fields it should? Are the data types correct? Is the structure consistent? 

      Status code validation — Did you get a 200 OK when you expected one? A 404 when a resource doesn’t exist? A 401 when auth fails? Status codes are the API’s way of communicating what happened — and you should be asserting them, not just hoping they’re right. 

      Parameterized testing — Can your API handle the full range of valid inputs? Can it gracefully reject invalid ones? Parameterized testing means running the same test logic across many different data combinations, so you’re not just testing the happy path. 

      Mock API testing — In many test environments, the real dependencies — databases, third-party services, downstream APIs — are not available or not stable enough to test against. Mock API testing means replacing those dependencies with controlled stand-ins so your tests run consistently regardless of what is happening outside your service. 

      What Problems Do Users Actually Face 

      What Problems Do Users Actually Face

      Here’s what actually happens when a team starts thinking about API testing. They don’t start by asking “how do I set up a full automation suite.” They start by asking much more immediate, frustrating questions. 

      1. “How do I even know if my API response is correct?”

      This is the starting question. You fire a request. Something comes back. But is it right? 

      The answer lives in three layers. First, the status code tells you whether the server understood and processed the request. Second, the response body tells you what the server actually returned. Third, the response schema tells you whether the structure of that body matches what you promised in your API contract. 

      Most teams only check the first layer — they see a 200 and call it a win. But a 200 with a wrong body or missing fields is not a win. It’s a silent failure that will bite you later down the development cycle when the frontend tries to use a field that isn’t there. 

      Proper response validation means checking all three: the status code, the presence and value of specific fields, and the shape of the entire response against a schema definition. 

      1. “What’s the difference between testing REST and testingGraphQL?”

      This is a question more teams are asking as GraphQL adoption keeps climbing. And it matters, because the rules are fundamentally different. 

      With REST, you have multiple endpoints — each one does a specific thing, and the response structure is fixed. A GET /users/42 always returns the same shape. Testing it means checking that specific shape against your expectations. 

      With GraphQL, you have one endpoint and the client decides what shape the response takes by writing a query. This creates a testing challenge that REST doesn’t have: because the response shape is dynamic, you can’t write one static assertion and call it done. 

      There’s another problem that catches teams off guard: GraphQL can return an HTTP 200 OK even when your query failed. The error lives inside the response body, in an errors field. If you’re only checking the status code — which works fine for REST — you’ll miss every GraphQL error entirely. 

      In order to get around it you have to inspect the response body for errors explicitly. This single difference in how errors are communicated is the most important thing to understand when moving from REST API testing to GraphQL API testing. 

      1. “How do I test APIs that require authentication?”

      In almost every production case your API will require some form of authentication. Bearer tokens, API keys, OAuth flows, session cookies — testing any of these requires your test suite to handle credential management cleanly. This is also where API security testing begins. Verifying that protected endpoints reject unauthenticated requests, that tokens expire correctly, and that permission boundaries hold is not optional — it is a core part of a complete API test strategy. 

      The practical approach: don’t hardcode credentials into your tests. Use environment variables or a secrets manager so the same test can run against your dev, staging, and production environments with different credentials. Your tests should be portable — they shouldn’t care which environment they’re running in as long as the right credentials are injected. 

      For OAuth flows specifically, you often need to run an authentication step first, capture the token from that response, and then pass it as a header in all subsequent requests. This is called request chaining — using the output of one request as the input to another — and it’s a core skill in API test automation. 

      Beyond OAuth, teams working with API key authentication should verify that invalid or expired keys return the correct 401 or 403 responses, and that keys scoped to specific permissions cannot access resources outside their scope. These are not edge cases — they are the baseline for API security testing done properly. 

      1. “What is parameterized testing and why does everyone keep talking about it?”

      Parameterized testing is how you test more than one scenario without writing duplicate test logic. 

      Here’s the problem it solves. You have an endpoint that creates a user. You want to test it with a valid email, an invalid email, a missing email, an email that’s already taken, and an email with unusual characters. Without parameterized testing, you write five separate, nearly identical tests. With parameterized testing, you write one test and provide a data set — and the test runner executes your logic once for each row of data. 

      The result is dramatically better coverage with dramatically less code. And when your endpoint’s logic changes, you only have to update one test, not five. 

      The data set for a parameterized test usually covers three categories: valid inputs that should succeed, invalid inputs that should fail with a specific error, and boundary inputs — the edge cases that live right at the limits of what’s acceptable. 

      1. “How do I validate that the API response has the right structure?”

      This is schema validation, and it’s one of the most valuable checks you can add to your test suite because it catches an entire class of bugs that individual field assertions miss. 

      Here’s the idea. Your API has a contract — it promises to return data in a specific structure. A user object has an id (number), a name (string), and an email (string). Schema validation means asserting that every response matches this contract, not just the specific fields you manually thought to check. 

      Why does this matter? Because APIs drift. A developer renames a field. A new version of a library changes a serialization behavior. A third-party dependency starts returning a different format. These changes don’t always cause obvious errors. They slip through. Schema validation catches them before they reach production. 

      Tools like JSON Schema let you define the exact expected structure of your responses and assert every response against it automatically. Think of it as having a strict contract enforcer running on every test run. 

      1. “How do I test my API automatically every time I push code?”

      This is the shift from “I have tests” to “I have a testing culture.” The answer is CI/CD integration — connecting your test suite to your deployment pipeline so tests run automatically on every pull request or code push. 

      The practical flow: code change is pushed, your CI system triggers, it spins up your test suite against a staging environment, tests run, and the results come back before the code is allowed to merge. If tests fail, the merge is blocked. If they pass, you have confidence that the change didn’t break anything tested. 

      This is what shift-left testing means in practice — catching bugs at the code review stage, where fixing them takes minutes, rather than in production, where fixing them takes hours and costs user trust. Shift-left testing is not just a philosophy. It is a concrete workflow change: move your automated API tests earlier in the development cycle so that regression testing in CI/CD becomes the norm, not an afterthought. When regression testing runs on every push, you stop asking “did this change break something?” and start knowing the answer before the PR merges. 

      Continuous API testing takes this a step further. Instead of running tests only when code changes, continuous testing schedules test runs against production or staging environments at regular intervals — catching issues caused by infrastructure changes, third-party API behavior shifts, or data drift that no code change triggered. 

      REST API Automation: The Practical Mental Model 

      When you’re automating REST API tests, it helps to think of every test as having four parts. 

      Setup — What state does the world need to be in before this request is made? Do you need a user to exist? Do you need to be authenticated? Create that state first. This is also where mock API testing plays a role — if a downstream service is not available in your test environment, a mock replaces it so your test can still run predictably. 

      Action — Send the request. One request per test is the cleaner approach. Tests that do too many things at once are hard to debug when they fail. 

      Assert — Check everything relevant. Status code. Specific response fields. Response schema. Response time if performance matters for this endpoint. 

      Teardown — Clean up what you created. If you created a test user in setup, delete them in teardown. Your tests should leave the environment in the same state they found it. 

      The most common mistake in REST API automation is skipping setup and teardown, which means tests start depending on each other — test B only passes if test A ran first and created the right data. This is called test coupling, and it makes your test suite fragile and hard to run in parallel. 

      When you are working in a microservices environment, this mental model becomes even more important. Each service has its own test suite, its own setup requirements, and its own dependencies. REST API automation that skips proper setup and teardown in a microservices context does not just cause flaky tests — it causes tests that pass individually but fail when run together, which gives you false confidence at exactly the wrong moment. 

      GraphQL API Testing: The Rules Are Different Here 

      GraphQL testing requires a specific mindset shift. Because the schema is strongly typed and clients write their own queries, your testing strategy needs to cover things that don’t exist in REST. 

      Schema validation testing — Test that your schema accurately reflects your business logic. If a field is marked as non-nullable in the schema, verify that it genuinely never returns null. If a type is defined as an integer, verify no code path sneaks a string in. 

      Query variation testing — Unlike REST where each endpoint has a fixed response, GraphQL lets clients request different subsets of data. Test the combinations that your real clients actually use, plus boundary cases like requesting no fields or requesting nested relationships several levels deep. 

      Mutation testing — Mutations are GraphQL’s way of writing data. They’re the equivalent of POST, PUT, and DELETE in REST. Test that mutations actually change the underlying data — not just that they return a success response, but that a subsequent query reflects the change. 

      Error field inspection — Every GraphQL test should check the errors field in the response body, not just the HTTP status code. A response with ”data”: null and a populated errors array is a failure, even if it arrived with a 200 OK. 

      Status Code Validation: The Complete Picture 

      Status codes are the API’s vocabulary — they communicate intent. Not asserting them explicitly is how silent failures happen. 

      Here’s the vocabulary your tests should know at all times: 

      200 OK — The request succeeded and the response contains the requested data. Assert this for successful GET requests and successful operations. 

      201 Created — A resource was successfully created. This is the correct code for successful POST requests that create things, and it’s subtly different from 200. If your API returns 200 when it should return 201, that’s worth catching. 

      400 Bad Request — The client sent something malformed. Missing required fields, wrong data types, invalid values. Your tests should send intentionally bad requests and assert they receive 400. 

      401 Unauthorized — No valid credentials were provided. Test your protected endpoints without auth headers and assert 401. 

      403 Forbidden — Valid credentials, but not enough permission. These two (401 and 403) are frequently confused and frequently misused. Testing both explicitly is important. 

      404 Not Found — The resource doesn’t exist. Request a non-existent ID and assert 404. 

      429 Too Many Requests — Rate limiting kicked in. If your API has rate limits, test that they work. 

      500 Internal Server Error — Something broke on the server side. Your tests should not be triggering these — which means if they do, you’ve found a real bug. 

      How qAPI Brings This All Together 

      How qAPI Brings This All Together

      Most teams do not fail at API testing because they lack knowledge. They fail because the gap between knowing what to do and having a working setup feels too wide to cross between sprints. 

      qAPI is built to close that gap. 

      1. Automated test generation — qAPI analyzes your API spec or live traffic and generates an initial test suite covering status codes, response validation, and schema checks. You start with coverage from day one instead of building from scratch. 
      2. Schema and contract validation — Every test run validates response structure against your defined schema and flags drift between what your API promises and what it actually returns. 
      3. Environment management — Dev, staging, and production environments with separate credentials, base URLs, and configurations — managed in one place, inherited by every test automatically. 
      4. CI/CD integration — Trigger test runs via CLI or webhook. Results surface in your pipeline with clear pass/fail signals before any merge happens. 
      5. Continuous monitoring — Schedule test runs independently of deployments. Get alerted when third-party APIs, infrastructure changes, or data drift cause behavior to shift without any code change triggering it. 
      6. GraphQL support — You can easily handle GraphQL queries, mutations, schema validation, and automatic errors with ease in inspection. 
      7. Microservices ready — Test sequencing, request chaining, and environment state management that keeps you keep tests isolated and reliable at scale.  

      Good Testing Is Just Good Engineering 

      Here’s the honest summary. Automated API testing is not a task you do once and forget. It’s a discipline you build into how you work. 

      The teams that do it well don’t have elaborate setups or exotic tooling. They have one thing: a habit of asking “how will I know this is still working next week?” before they ship anything. 

      Start with the basics. Assert your status codes. Validate your response bodies. Write parameterized tests for your most critical endpoints. Hook those tests into your CI pipeline so regression testing runs on every push. Then build from there — adding integration testing across your services, schema validation for response contracts, and eventually API contract testing to ensure independently deployed services never quietly break each other. 

      The goal isn’t 100% coverage on day one. The goal is making every deployment a little less terrifying than the last one — until the day comes when you ship with actual confidence, because your test suite is doing the worrying for you. 

      That’s what qAPI is built to help you get to. Without the weeks of setup, without the maintenance overhead, without needing every team member to be a test automation expert. 

      Your API works hard. Test it like it matters. 

      Frequently Asked Questions

      API testing is the act of verifying that an API works correctly — sending requests and checking responses. API automation means doing this programmatically, without human intervention, on a repeatable schedule or trigger. Manual API testing using a GUI tool is still testing. It becomes automation when a script or tool runs those checks on its own.

      It depends on the tool. Traditional frameworks like REST Assured or pytest require coding knowledge. Modern tools like qAPI are designed so that QA analysts, product managers, and non-developer roles can build and run tests without writing code — while still giving engineers the depth they need for complex scenarios.

      Schema validation checks that the entire structure of an API response matches an expected definition — not just specific fields, but every field's name, data type, and whether it's required or optional. It's important because APIs drift over time, and schema validation catches structural changes automatically before they reach production.

      The core difference is that REST APIs have fixed endpoints with fixed response shapes, while GraphQL uses a single endpoint where the response shape is determined by the client's query. This means GraphQL testing must cover query variations, schema integrity, and mutation side effects. Critically, GraphQL can return HTTP 200 even when a query fails — errors appear in the response body, not the status code.

      Parameterized testing means running the same test logic with multiple different input values. Instead of writing five separate tests for five different user email scenarios, you write one test and supply a data table. This gives you much broader coverage with much less code, and makes tests easier to maintain when logic changes.

      At minimum: 200 for successful responses, 201 for successful resource creation, 400 for bad request validation, 401 for missing authentication, 403 for insufficient permissions, 404 for missing resources, and 429 for rate limiting. Each of these represents a distinct contract between your API and its consumers.

      Store credentials in environment variables, never hardcode them in test files. For token-based auth, run a login or token-generation request first, capture the token, and inject it as a header in subsequent requests. This is called request chaining. Good API testing tools handle this natively so you don't have to wire it manually.

      Your test suite needs to be runnable from the command line with a single command. Most CI systems — GitHub Actions, GitLab CI, Jenkins — can then be configured to run that command on every pull request or code push, against a staging environment. Tests that fail block the merge. Tests that pass give you a green light to deploy.

      The N+1 problem occurs when a GraphQL resolver makes a separate database call for each item in a list — fetching a list of 100 posts and then making 100 individual calls to fetch each post's author. Your tests should include performance assertions to catch this pattern, because it works fine in development with small data and quietly destroys performance in production with real data.

      Start with your most critical endpoints — the ones that, if broken, would immediately impact your users or your business. For each one, write four tests: a happy path (valid request, expected success response), an auth failure (no credentials, expect 401), a bad input test (invalid data, expect 400), and a not-found test (non-existent ID, expect 404). That's your foundation. Everything else builds from there.

      Every AI product team is talking about leveraging AI.   But why does your AI sound brilliant in demos… but struggle with real user questions? Why can’t it answer about your latest pricing, internal docs, or customer cases? And why does it sometimes confidently give answers that are just… wrong? 

      Here’s why it happens 

      You plug a good LLM into your product—GPT-4o, Claude, Gemini, Llama 3. The results are impressive. It writes fluently. It sounds intelligent. It feels like magic. 

      Then if you try to use it in the real world, problems arise. Because you need it to answer questions about your internal documentation. Your product database. Your compliance policies. Last month’s pricing update. The customer case filed three days ago. 

      And it can’t.  

      Not because the model is dumb. Because the model doesn’t know. 

      Its knowledge is frozen in time, sealed at whatever date it stopped training. Everything that happened after that date — every document your company wrote, every update your team published, every piece of context that makes your application genuinely useful — is invisible to it. 

      This is the problem RAG was built to solve. 

      Retrieval-Augmented Generation is one of the most consequential architectural patterns in modern AI development. It’s the reason enterprise AI assistants can answer questions about real documents. It’s why AI-powered customer support can reference live product data. It’s how legal AI tools cite actual case law instead of inventing it. 

      This guide covers everything product teams need to understand about RAG — what it is, how it works, the seven types you’ll encounter in production, the four complexity levels that determine what architecture you actually need, and the critical decision between RAG and LLM fine-tuning that every team building with AI will eventually face.

      1. What Is RAG? The Core Concept Explained Simply

      RAG stands for Retrieval-Augmented Generation. Basically, it’s an architectural pattern that gives an LLM access to external knowledge before it generates a response. 

      Here’s the simplest way to understand it. 

      A standard LLM is like a doctor who graduated medical school in 2022 and hasn’t read a single paper, attended a conference, or updated their knowledge since. They’re highly intelligent. Highly capable.  

      But everything they know is from before they graduated. Ask them about a treatment protocol published last month — they can’t help you. They might fabricate an answer that sounds convincing, because that’s what LLMs do when they don’t know something. But it will be wrong. 

      RAG is like giving that same doctor access to a medical library before they answer your question. They still bring the intelligence, the reasoning, the language ability. But now, before they respond, they look up the relevant papers. They pull the current guidelines. They check the most recent research. Then they answer. 

      The output isn’t just smarter. It’s grounded in something real and verifiable. 

      Technically, as AWS defines it: RAG is the process of optimizing the output of an LLM so it references an authoritative knowledge base outside of its training data sources before generating a response. The key phrase is “outside of its training data” — this is the information that didn’t exist when the model was trained, or that belongs specifically to your organization and will never be in any public training set. 

      The Two Components of Every RAG System 

      Every RAG implementation — regardless of complexity — has two core components working in sequence: 

      The Retriever: This component takes the user’s query, searches your external knowledge base (usually a vector database), and pulls back the most relevant chunks of information. It’s essentially a smart search engine that understands semantic meaning, not just keyword matching. 

      The Generator: This is your LLM. It takes the user’s original query plus the retrieved context and generates a response that synthesizes both. The model isn’t just reciting what it found — it’s reasoning over the retrieved documents to produce a coherent, useful answer. 

      What comes out is more accurate, more specific, more up-to-date, and — critically — it can point to sources. 

      1. Why Is Everyone Talking About RAG Right Now?

      RAG isn’t new. The foundational research from Meta AI, University College London, and New York University dates to 2020. But the reason it’s a primary topic for every serious AI team in 2025–2026 is the intersection of three forces that are happening simultaneously.

      Everyone Talking About RAG

      Force 1: LLM Adoption Moved From Experiments to Production 

      In 2023, most teams were building demos and exploring what was possible. In 2025 and 2026, those teams are shipping production applications — customer-facing products, internal tools, workflow automations — that need to perform reliably. And production performance means you can’t accept hallucinations, stale data, or inability to access proprietary knowledge. RAG is the architectural solution to all three of those problems. 

      Force 2: Knowledge Changes Faster Than Models Can Retrain 

      An LLM training run is expensive, slow, and permanent. Once a model is trained, its internal knowledge is frozen. But the real world doesn’t freeze. Regulations change. Products update. Markets shift. New research publishes daily. The gap between what an LLM was trained on and what’s actually true today grows continuously. 

      RAG bridges that gap without requiring retraining. Your knowledge base updates in real time. The model stays the same. The outputs stay current. 

      Force 3: Enterprise Data Is Proprietary and Won’t Be in Training Sets 

      The most valuable knowledge for most organizations — their internal documentation, customer history, contracts, processes, and institutional memory — will never appear in a public LLM training set. It’s private. It’s sensitive. It’s specific to them. 

      RAG is the mechanism that lets organizations keep their data private and still make it usable by AI. You don’t hand your data to OpenAI to retrain the model. You store it in your own vector database, retrieve from it at query time, and never expose it in bulk to anyone. 

      This alignment with enterprise priorities — accuracy, explainability, data privacy, cost efficiency, and compliance — is exactly why RAG has gone from a research pattern to a production architecture standard in under three years. 


      1. How RAG Works: The Three-Step Pipeline

      Understanding RAG will immediately remove a lot of confusion for you. The process follows three stages, regardless of which variant you’re building.

      How RAG Works

      Stage 1: Indexing (The Setup Phase) 

      Before any query happens, you prepare your knowledge base. This means: 

      1. Document ingestion: You feed your external knowledge — PDFs, web pages, database records, API outputs, help documentation, whatever is relevant — into the system. 
      2. Chunking: Documents are broken into smaller pieces. A 40-page user manual becomes 200 bite-sized chunks that can each be retrieved independently. The chunk size matters — too small and you lose context, too large and retrieval becomes imprecise. 
      3. Embedding: Each chunk is converted into a numerical vector — a long list of numbers that represents the semantic meaning of that text. Two sentences that mean similar things will have similar vectors, even if they use different words. 
      4. Vector storage: These embeddings are stored in a vector database — tools like Pinecone, Weaviate, Qdrant, Chroma, or Milvus are built for this purpose. 

      Stage 2: Retrieval (The Query Phase) 

      When a user asks a question: 

      1. The query is converted into an embedding using the same model that was used for the documents. 
      2. The system performs a similarity search across the vector database — mathematically finding which stored chunks are most semantically similar to the query. 
      3. The top-k most relevant chunks are retrieved. These might be 3 chunks, 10 chunks, 20 chunks — this is a configurable parameter that trades precision against context window size. 

      Stage 3: Generation (The Response Phas e) 

      1. The retrieved chunks are injected into the LLM’s context window alongside the original query. 
      2. The LLM generates a response that synthesizes the retrieved information with its training knowledge. 
      3. The output is grounded in your actual documents — and can cite specific sources. 

      This is the fundamental pipeline. Everything from Naive RAG to Agentic RAG is a variation on this three-stage flow. 

      1. The 7 Types of RAG (And When to Use Each)

      The RAG landscape has matured significantly. What started as one approach has differentiated into seven distinct types, each suited to different use cases and problem profiles. Here’s what each one actually is and when it’s the right choice.

      7 Types of RAG

      Type 1: Naive RAG (The Starting Point) 

      Naive RAG is the original implementation of the pattern. It’s straightforward: take a query, convert it to an embedding, retrieve the closest matches from a vector database, stuff those matches into the prompt, generate a response. No filtering, no reranking, no optimization. 

      How it works: Query → embedding → vector similarity search → top-k results → prompt → LLM → response. There’s no step where you evaluate whether the retrieved documents are actually relevant or whether the response is accurate. 

      Where it works well: Simple chatbots with a predictable, bounded scope. Internal FAQ systems where questions are predictable and the knowledge base is small and clean. Rapid prototypes where you need to validate whether a RAG approach is viable before investing in optimization. 

      Where it breaks: When queries are ambiguous or multi-hop (requiring information from multiple documents). When the knowledge base is noisy. When the question and the answer use different vocabulary. Naive RAG struggles with low precision — it retrieves misaligned chunks — and low recall — it fails to retrieve all the relevant chunks that exist. 

      The honest assessment: Naive RAG is a good proof-of-concept. It’s not a production architecture for complex applications. 

      Type 2: Advanced RAG (The Production Default) 

      Advanced RAG is Naive RAG with optimization layers added before and after retrieval. It’s the minimum viable architecture for most production applications. 

      Pre-retrieval optimizations include: 

      1. Query rewriting: The user’s query is rewritten or expanded before retrieval to improve the semantic match with stored documents. A vague user question becomes a more precise retrieval query. 
      2. HyDE (Hypothetical Document Embeddings): The model generates a hypothetical ideal answer, embeds that, and uses it to retrieve documents. This improves retrieval when the question and the answer space use different language. 
      3. Better chunking strategies: Semantic chunking (splitting on topic boundaries rather than fixed token counts) produces better retrieval than naive fixed-size chunking. 

      Post-retrieval optimizations include: 

      1. Reranking: A second model (a cross-encoder) re-scores the retrieved chunks for relevance. The initial retrieval casts a wide net; the reranker picks the best fish. 
      2. Context compression: Irrelevant portions of retrieved chunks are filtered out before being passed to the LLM, reducing noise and preserving context window space for the most useful content. 

      Where it works well: Most standard production applications — customer support assistants, internal knowledge bases, documentation search, product Q&A. The combination of better retrieval and better context handling makes this the right default. 

      The benchmark guidance: Advanced RAG is the sweet spot of cost versus quality for the majority of use cases. If Naive RAG accuracy isn’t meeting your bar, add hybrid retrieval and a re ranker before considering anything more complex. 

      Type 3: Modular RAG (The Flexible Architecture) 

      Modular RAG is the architectural evolution that treats RAG not as a fixed pipeline but as a set of composable modules that can be assembled, replaced, and extended. 

      How it works: Instead of a fixed retrieve-augment-generate sequence, Modular RAG decomposes the system into specialized components: 

      1. Search module: Handles retrieval from multiple sources simultaneously — vector databases, search engines, APIs, SQL databases. 
      2. Memory module: Stores past interactions to maintain context across multi-turn conversations. 
      3. Routing module: Decides which retrieval source and strategy is appropriate for a given query type. 
      4. Task adapter: Adjusts retrieval behavior for specific task types — summarization, Q&A, comparison, extraction. 
      5. Fusion module: Combines results from multiple retrieval strategies. 

      Where it works well: Complex enterprise applications where different query types need different retrieval strategies. Multi-domain knowledge bases where a single retrieval approach can’t cover all cases. Applications that need to iterate and improve components independently without rebuilding the entire pipeline. 

      The key insight: Both Naive RAG and Advanced RAG are actually special cases of Modular RAG — they’re just Modular RAG with fixed modules. Modular RAG is what you build when your fixed pipeline is no longer flexible enough. 

      Type 4: Hybrid RAG (The Accuracy Optimizer) 

      Hybrid RAG combines multiple retrieval methods — typically dense vector search and sparse keyword search — to capture what each method alone would miss. 

      The problem it solves: Dense vector search is excellent at finding semantically similar content even when phrasing differs. But it can miss exact keyword matches that a user or document might require. Sparse search (BM25, traditional TF-IDF) is excellent for exact term matching but misses semantic similarity. Hybrid RAG uses both, then fuses the results. 

      How it works: A query is run through both a vector similarity search and a keyword-based search simultaneously. The results from both pipelines are then combined using a fusion strategy — Reciprocal Rank Fusion (RRF) is common — that blends the two result sets into a single ranked list. 

      Where it works well: Domain-specific applications where precise terminology matters — legal documents with specific clause numbers, medical literature with exact drug names, technical documentation with specific error codes. Any scenario where you need both semantic understanding and exact-match precision. 

      The production note: Enterprise RAG implementations are increasingly defaulting to hybrid retrieval because it consistently outperforms single-method pipelines on accuracy, especially in noisy enterprise datasets. 

      Type 5: Multimodal RAG (The Format-Agnostic System) 

      Multimodal RAG extends retrieval beyond text to handle images, audio, video, tables, charts, diagrams, and structured data — any information format that real-world knowledge actually lives in. 

      How it works: Documents are processed not just as text but as their native formats. Charts are analyzed for their underlying data. Images are embedded using vision models. PDFs with tables have those tables extracted and indexed separately from the surrounding prose. Audio is transcribed and processed. The retrieval system then queries across all these modalities based on a text prompt. 

      Where it works well: Industries where knowledge is inherently multimodal — engineering and manufacturing (equipment manuals with diagrams), healthcare (clinical documentation with imaging), financial analysis (reports with charts and tables), product management (design documents, user research videos). Anywhere the answer to a question might live in a graph rather than a paragraph. 

      The current reality: As of mid-2025, Multimodal RAG has not fully lived up to its early momentum because the supporting infrastructure remains immature. Late interaction models are still dominating the space, meaning embedding models produce multi-vector representations (a single image may require over 1,000 vectors) that create significant storage and retrieval overhead. The capability is real; the production cost is still high. 

      Type 6: Adaptive RAG (The Resource-Intelligent System) 

      Adaptive RAG adds a decision layer that evaluates whether retrieval is even necessary for a given query, and if so, how much. 

      How it works: Before retrieval, a classifier or small model evaluates the query. If the answer is something the base LLM already knows well (a general factual question, a simple calculation, a generic task), retrieval is skipped entirely. If the query requires specific external knowledge, retrieval is triggered — and the complexity of retrieval scales with how specific the need is. 

      Where it works well: High-volume applications where retrieval costs (latency and compute) matter significantly. Chatbots that handle a mix of general questions and domain-specific questions. Scenarios where adding retrieval latency to every query would degrade user experience. 

      The trade-off: You’re optimizing for cost and speed by being selective. The risk is that the classifier misfires — decides to skip retrieval when retrieval was needed — and the LLM falls back to hallucinating from training data. Adaptive RAG requires a well-calibrated routing model. 

      Type 7: Agentic RAG (The Autonomous Multi-Step System) 

      Agentic RAG replaces the linear pipeline with an autonomous agent that plans, retrieves, evaluates, and re-retrieves in a loop until the query is fully addressed. 

      How it works: The user’s query is handed to an agent (itself powered by an LLM) that breaks the query into sub-questions, plans a retrieval strategy, retrieves documents, evaluates whether what was retrieved is sufficient to answer the sub-questions, and iterates — retrieving again, from different sources, with different queries — until the agent is confident it has enough context to generate a complete answer. 

      For a query like “Compare our Q3 performance against industry benchmarks and identify where we underperformed,” an Agentic RAG system might retrieve Q3 internal financial data, retrieve industry benchmark data from an external source, retrieve prior quarter data for context, and synthesize all three — not because it was told to, but because the agent reasoned that all three were necessary. 

      Where it works well: Complex, multi-hop queries that require combining facts across multiple documents or sources. Research applications where the system needs to reason about what it doesn’t yet know and go find it. Autonomous workflows where the answer requires a sequence of information-gathering steps. 

      The critical warning: Agents amplify errors. A 5% error rate in each step of a ten-step reasoning chain produces a significantly degraded output even if no individual step fails catastrophically. Agentic RAG is powerful and demands a trajectory evaluation strategy — evaluating the sequence of decisions and retrievals, not just the final output. 

      1. The 4 Levels of RAG Complexity

      Beyond the seven types, there’s a second framework that’s equally important for product teams: the four levels of RAG complexity. Where the types describe the architecture, the levels describe the cognitive task complexity of the queries your system needs to handle.  

      This framework comes from Microsoft Research and classifies RAG applications based on the type of external data and the cognitive processing required.

      4 Levels of RAG Complexity

      Level 1: Explicit Fact Retrieval 

      What it is: Direct factual queries where the answer is explicitly stated somewhere in the knowledge base. The model retrieves the statement and surfaces it. 

      Example queries: “What is the refund policy?” “What does the error code 403 mean in our system?” “What’s the maximum file size the API accepts?” 

      What the retrieval looks like: Semantic similarity search finds the document containing the answer. The LLM reads it and reports it. 

      Architecture required: Naive or Advanced RAG handles this well. The core requirement is high-quality chunking and embedding so the right document is actually retrieved. 

      Level 2: Implicit Fact Retrieval 

      What it is: Queries where the answer isn’t stated explicitly but can be derived from what is. The model must synthesize across multiple retrieved documents to produce an answer that isn’t directly written anywhere. 

      Example queries: “Based on our current SLA commitments and last quarter’s incident data, how many times did we fall short?” “What do our top three competitors have in common that we don’t offer?” 

      What the retrieval looks like: Multiple documents are retrieved and the model must combine information from them. The answer doesn’t exist as a single statement — it’s constructed from the combination. 

      Architecture required: Advanced RAG with reranking, and potentially Modular or Hybrid RAG to ensure all relevant documents are surfaced. The model needs enough retrieved context to make the synthesis. 

      Level 3: Interpretable Rationale 

      What it is: Queries that require the model to not just retrieve facts and synthesize them, but to apply domain-specific rules, constraints, or reasoning frameworks to those facts. 

      Example queries: “Given our data retention policy and GDPR compliance requirements, should we honor this deletion request?” “Based on our pricing rules and this customer’s contract tier, what discount are they eligible for?” 

      What the retrieval looks like: The model must retrieve both the factual data (the customer contract, the deletion request) and the relevant rules (the compliance policy, the pricing framework) and then reason about how the rules apply to the facts. 

      Architecture required: Advanced or Modular RAG, often with structured data retrieval alongside unstructured document retrieval. This level is where many teams first discover that Naive RAG is insufficient. 

      Level 4: Hidden Rationale (Multi-Hop Reasoning) 

      What it is: The most complex level. Queries that require multiple retrieval passes — where the answer to the first retrieval step determines what to retrieve next, and so on — to piece together an answer that requires multi-step logical inference. 

      Example queries: “When was the last time Jerry Rice and Steve Young played on the same NFL team?” (requires retrieving both players’ careers, then finding the intersection) “Which of our customers who adopted Feature X before July 2024 have NOT renewed since the pricing change?” 

      What the retrieval looks like: The model retrieves initial data, reasons about what additional data it needs based on the first results, retrieves again, reasons again. This is inherently iterative, not linear. 

      Architecture required: Agentic RAG with chain-of-thought prompting guiding the retrieval steps. Graph-based RAG is also well-suited here, as relationship traversal naturally handles multi-hop reasoning. Standard one-shot retrieval will fail at this level. 

      1. RAG vs LLM: Understanding the Real Difference

      This question comes up constantly and the confusion is understandable because people use “LLM” to mean two different things. 

      When someone asks “should I use RAG or an LLM?”, they usually mean: should I just call the LLM API directly, or should I build a RAG layer in front of it? 

      The answer requires understanding what each approach actually does with knowledge. 

      What an LLM Is 

      A Large Language Model is a neural network trained on massive amounts of text. During training, patterns from that text are compressed into the model’s billions of parameters — its weights. The model learns language, reasoning patterns, facts, relationships, and concepts from everything it was trained on. 

      When you call an LLM directly, you’re accessing that compressed knowledge. The model generates responses from what it learned during training, combined with whatever you put in the current context window. 

      The fundamental constraint: The model’s internal knowledge is frozen at its training cutoff. It doesn’t know what happened yesterday. It doesn’t know what’s in your internal documents. It doesn’t know about the pricing change you made last week. And — critically — when it encounters a question it doesn’t have a good answer for, it doesn’t say “I don’t know.” It generates a plausible-sounding answer based on the patterns it learned. That’s a hallucination. 

      What RAG Does Differently 

      RAG doesn’t replace the LLM. It adds a retrieval layer that runs before the LLM generates a response. 

      The difference is in where the knowledge comes from. An LLM-only system generates from parametric memory — the patterns baked into its weights. A RAG system also generates from retrieved context — documents pull ed from external sources at the moment of the query.

      What RAG Does Differently 
      Dimension LLM Only RAG + LLM
      Knowledge source Training data (frozen) Training data + external documents (live)
      Knowledge currency Up to training cutoff Real-time
      Proprietary data Not accessible Accessible via knowledge base
      Hallucination risk High on specific/recent facts Significantly reduced
      Source attribution None Documents can be cited
      Setup complexity Zero Requires retrieval infrastructure
      Cost per query Token cost only Token cost + retrieval cost
      Best for General reasoning, creation, transformation Specific facts, organizational knowledge, Q&A

      The Most Important Reframe 

      RAG and LLM aren’t competing options. RAG uses an LLM — it just gives the LLM better context to work with. The question isn’t “RAG or LLM?” It’s “LLM only, or LLM with retrieval?” 

      As one production guide puts it: most mature AI teams aren’t choosing one over the other. They’re running LLMs for generation and RAG to keep those outputs grounded in real, current, specific knowledge. 

      1. RAG vs Fine-Tuning: The Decision That Shapes Your Roadmap

      Fine-tuning is the other major technique for making an LLM more useful for a specific domain or task. Understanding when to use RAG versus fine-tuning — and when to use both — is one of the most consequential architectural decisions an AI product team makes. 

      What Fine-Tuning Actually Does 

      Fine-tuning updates the weights of a pre-trained LLM by training it on additional domain-specific data. The model’s internal parameters change. It becomes better at the specific patterns, vocabulary, tone, and task format represented in your fine-tuning data. 

      Think of fine-tuning as changing how the model behaves. RAG changes what the model can see. 

      The Core Decision Rule 

      Put volatile knowledge in retrieval. Put stable behavior in fine-tuning. 

      This rule covers most cases: 

      1. If your knowledge changes frequently (product data, pricing, regulations, news), use RAG. Updating a vector database is fast and cheap. Retraining a model is slow and expensive. 
      2. If you need to change how the model responds — its output format, its tone, its reasoning style for a specific task type, its domain-specific language — use fine-tuning. 
      3. If you need both accurate, current knowledge AND specific behavioral adaptation, use both together. 

      The Practical Comparison 

      RAG is better when: 

      1. Your knowledge updates regularly (weekly, daily, or faster) 
      2. You need source attribution and verifiability 
      3. Data privacy requires keeping content out of model weights 
      4. You want to change what the model knows without retraining 
      5. You’re cost-constrained and can’t afford fine-tuning compute 
      6. You’re in an early stage and need to iterate quickly 

      Fine-tuning is better when: 

      1. You need a consistent output format or style the base model doesn’t produce naturally 
      2. Your domain has specific jargon, vocabulary, or reasoning patterns 
      3. Response latency is critical (fine-tuned models can be faster — no retrieval step) 
      4. You have enough labelled data to produce meaningful adaptation 
      5. Your knowledge is stable and won’t change significantly 

      An important architecture note from 2025 and 2026 production experience: If your total knowledge base fits comfortably within an LLM’s context window (for many use cases, this means under roughly 200,000 tokens), full-context prompting with prompt caching may be faster and cheaper than building retrieval infrastructure at all. This is a significant architectural simplifier for bounded internal tools and documentation assistants. RAG is the right choice when your knowledge base is too large to fit in context, or when you need selective, precise retrieval from a large corpus. 

      1. What Product Teams Need to Know About RAG

      Here’s the layer of knowledge that most technical guides skip — the practical things that determine whether your RAG implementation ships and works, not just whether it’s architecturally correct. 

      1. Retrieval Quality Is the Whole Game
      What Product Teams Need to Know About RAG

      The quality of your RAG output is almost entirely determined by the quality of what you retrieve. If the relevant document is in the knowledge base but retrieval doesn’t surface it, the LLM can’t use it. If noisy, irrelevant chunks are retrieved, they degrade the response. The most common production failure mode in RAG is not poor generation — it’s poor retrieval. 

      This means chunking strategy, embedding model choice, reranking, and knowledge base curation are not infrastructure details. They’re product quality decisions. 

      1. Garbage In, Garbage Out — But at Retrieval Speed

      A RAG system is only as good as the knowledge base it retrieves from. Outdated documentation, inconsistent terminology, poorly structured content, and duplicate entries all degrade retrieval precision. Before building your RAG pipeline, audit your knowledge base. Treat it as a first-class data product, not a file dump. 

      1. Evaluation Is Not Optional

      How do you know your RAG system is working? Not from the demo. Not from your own test queries. From systematic evaluation against a representative benchmark dataset of real user questions, with defined quality metrics. 

      The minimum metrics to track: 

      • Answer relevance: Is the generated answer actually addressing the question? 
      • Faithfulness: Is the answer grounded in the retrieved documents, or is the model drifting to hallucination? 
      • Context recall: Are the right documents being retrieved? Are relevant documents being missed? 
      • Context precision: Of what’s being retrieved, how much of it is actually relevant? 

      Tools like RAGAS provide automated frameworks for evaluating these dimensions at scale. This is non-negotiable for production systems. 

      1. RAG Has a Latency Cost — and You Need to BudgetForIt 

      Adding a retrieval step adds latency. Depending on your vector database, embedding model, reranking step, and network conditions, a RAG system adds 100ms–800ms compared to a direct LLM call. For some applications this is irrelevant. For a real-time customer support interface, it matters enormously. 

      Design for this from the start: asynchronous loading indicators, streaming responses that begin while retrieval completes, and architectural choices that parallelize retrieval where possible. 

      1. Chunking Is a Product Decision,Nota Technical Default 

      Most developers set chunk size once, use a default value, and forget about it. But chunk size determines what unit of information gets retrieved, and different applications have very different optimal chunk sizes. 

      • Short chunks (128–256 tokens) give high precision — you retrieve only what’s relevant — but lose surrounding context that helps the model understand the retrieved fragment. 
      • Long chunks (512–1024 tokens) preserve context but introduce noise and eat context window space. 
      • Hierarchical chunking (small chunks for retrieval, larger parent chunks for context) is the emerging best practice for most production systems. 

      The right chunk size depends on your content type, your query distribution, and your context window budget. Test it explicitly rather than accepting defaults. 

      1. Security and Access Control Are Your Responsibility

      RAG systems connect your LLM to your internal data. If that data contains sensitive information — which it almost always does — you are responsible for ensuring the right users can only retrieve documents they’re authorized to see. 

      This means implementing access control at the retrieval layer, not just the application layer. A retrieved document that a user wasn’t authorized to see shouldn’t appear in the LLM’s context, regardless of how the LLM handles it from there. 

      1. RAG in Practice: Industry Use Cases That Actually Work

      Legal and Compliance 

      Legal AI assistants use RAG to retrieve actual case law, regulatory text, contract clauses, and compliance requirem ents before answering legal questions. This is a category where hallucination has serious consequences — citing a case that doesn’t exist, or misrepresenting a regulatory requirement, creates real liability. RAG grounds every response in retrievable, citable sources.

      RAG in Practice

      Real pattern: A question about contract termination rights triggers retrieval of the relevant contract clauses, the applicable jurisdiction’s statutes, and recent case law — then generates an answer that cites all three. 

      Healthcare 

      Medical AI systems cannot afford to generate responses from 2022 training data when clinical guidelines were updated in 2024. RAG connects medical AI to live clinical guidelines, current drug interaction databases, and real-time diagnostic protocols. A 2025 study in npj Health Systems found that RAG-powered AI transforms healthcare by integrating real-time diagnostic data and the latest clinical research, ensuring medical decisions are based on current information. 

      Real pattern: A question about a drug interaction retrieves the current interaction database entry, the relevant clinical guideline, and any recent FDA safety updates — then synthesizes a response that reflects the latest available guidance. 

      Financial Services 

      Financial markets change by the second. Static model knowledge is useless for portfolio analysis, earnings interpretation, or regulatory compliance in a domain that operates in real time. Banks and investment firms use RAG to enable AI analysts that retrieve live market reports, earnings transcripts, and macroeconomic data before generating responses. 

      Real pattern: An analyst asks about a company’s debt position. The RAG system retrieves the most recent earnings call transcript, the Q2 10-Q filing, and current credit market data — then generates a synthesis with source citations that can be independently verified. 

      Customer Support 

      Customer support is one of the most common RAG deployments because the product knowledge base changes continuously — pricing, features, policies, known issues. A RAG-powered support system stays current automatically as the knowledge base updates, without requiring model retraining. 

      Real pattern: A customer asks why their API key isn’t working. The system retrieves the current authentication documentation, the recent changelog entry about a breaking change, and the troubleshooting guide — and generates a specific, accurate response rather than generic advice. 

      Internal Knowledge Management 

      Enterprise organizations contain enormous amounts of institutional knowledge locked in documents, wikis, emails, and databases that employees can’t efficiently search. RAG-powered internal assistants let employees ask natural language questions and get answers grounded in actual internal documentation — with citations they can follow to the source. 

      1. How to Evaluate If Your RAG System Is Working

      Building a RAG system is the first step. Knowing whether it’s actually working is the step most teams skip. 

      The Four Core Evaluation Metrics

      Evaluate If Your RAG System Is Working

      Context Recall asks: Of all the relevant documents that exist in the knowledge base, what percentage are actually being retrieved? This measures whether your retrieval is finding what it should find. Low recall means relevant information exists but isn’t surfacing. 

      Context Precision asks: Of everything being retrieved, how much of it is actually relevant? High precision means your retrieval is focused and not surfacing noise. Low precision means the LLM is being given too much irrelevant information, which degrades generation quality. 

      Faithfulness asks: Is the generated answer actually grounded in the retrieved documents? A high faithfulness score means the model is using what it retrieved. A low faithfulness score means the model is drifting — hallucinating content that wasn’t in the retrieved context. 

      Answer Relevance asks: Does the final response actually address what the user asked? This is the end-to-end quality metric that matters to users. 

      The Evaluation Rule for RAG 

      A RAG system can fail at retrieval (right documents not found), at augmentation (retrieved documents not being used effectively), or at generation (the LLM producing a poor answer from good context). Evaluation must cover all three stages independently, because a failure at any stage produces a bad output even if the other two stages are working correctly. 

      Building a RAG Evaluation Dataset

      Building a RAG Evaluation Dataset

      Your evaluation benchmark needs to include: 

      1. Questions where the answer is clearly in the knowledge base (tests recall) 
      2. Questions where the answer requires synthesizing multiple documents (tests reasoning) 
      3. Questions that are intentionally ambiguous or adversarial (tests robustness) 
      4. Questions that probe the boundaries of what the system should and shouldn’t retrieve (tests access control and scope) 

      Run this evaluation benchmark on every version of your RAG system — every change to chunk size, embedding model, retrieval strategy, or knowledge base content should be validated against it. 

      1. Conclusion: RAG Is an Architecture Decision,Not a Feature 

      The most important framing shift for product teams thinking about RAG: it’s not a feature you add to an LLM application. It’s an architectural decision about where your AI product’s intelligence lives. 

      An LLM-only system puts all its intelligence inside model weights — frozen, static, unable to access your world. A RAG system distributes intelligence across two places: the model’s reasoning capabilities, and your living, updateable, proprietary knowledge base. 

      That distribution is what makes AI products that work in the real world, not just in demos. 

      RAG has evolved from a simple research paper pattern to a production-critical architecture. The seven types — Naive, Advanced, Modular, Hybrid, Multimodal, Adaptive, and Agentic — give you a design vocabulary for matching architecture to problem complexity. The four levels of complexity give you a framework for scoping what kind of cognitive work your system needs to do. 

      The teams building reliable AI products in 2025 and 2026 have learned a consistent lesson: get the retrieval right before you optimize the generation. The quality of what you retrieve determines the ceiling of what you can generate. No LLM is good enough to fix bad retrieval. 

      Build your knowledge base like it’s a product. Evaluate your retrieval with the same rigor you’d apply to a feature. Test with real user queries, not curated demos. 

      That’s how RAG works at its best — not as a magic layer that makes LLMs smarter, but as a disciplined architecture that makes AI grounded in the truth of your domain. 

      FAQs

      RAG stands for Retrieval-Augmented Generation. It's an architecture that lets an AI model look up relevant information from an external knowledge base before generating a response, rather than relying only on what it learned during training. The result is answers that are more accurate, more current, and grounded in documents that can be cited.

      LLMs are trained on general public data up to a cutoff date. They don't know what happened after that date, they don't have access to your organization's private documents, and they can't cite specific sources. RAG solves all three of these limitations by adding a retrieval step that pulls relevant, specific, current information before the model responds.

      RAG changes what the model can see at query time — it gives the model access to external documents. Fine-tuning changes how the model behaves — it updates the model's internal parameters to make it better at specific tasks, tones, or domains. Use RAG for knowledge that changes frequently or is proprietary. Use fine-tuning for stable behavioral adaptations. Many production systems use both together.

      The seven types are: Naive RAG (basic retrieval without optimization), Advanced RAG (with pre- and post-retrieval optimization), Modular RAG (composable, flexible architecture), Hybrid RAG (combining vector and keyword search), Multimodal RAG (handling text, images, and other formats), Adaptive RAG (selective retrieval based on query type), and Agentic RAG (autonomous multi-step retrieval with planning).

      The four levels describe the cognitive complexity of the queries your system handles. Level 1 is explicit fact retrieval (answer is directly stated in documents). Level 2 is implicit fact retrieval (answer must be synthesized from multiple sources). Level 3 is interpretable rationale (requires applying domain rules to retrieved facts). Level 4 is hidden rationale, also called multi-hop reasoning (requires iterative retrieval where each step informs the next).

      RAG adds infrastructure complexity, latency, and maintenance overhead. If your knowledge base is small enough to fit in an LLM's context window (often under 200,000 tokens), full-context prompting with prompt caching may be simpler and cheaper. If your use case is pure content generation, code writing, or general reasoning with no proprietary knowledge requirements, a direct LLM call is sufficient.

      Agentic RAG replaces the one-shot retrieval pipeline with an autonomous agent that plans, retrieves, evaluates whether the retrieved information is sufficient, and iterates — retrieving again from different sources or with different queries — until it has enough context to produce a complete answer. It's the right architecture for complex multi-hop queries, but requires trajectory-level evaluation because errors compound across each retrieval step.

      The most common failure is poor retrieval, not poor generation. If the relevant documents aren't being retrieved — because of bad chunking, a poor embedding model, inappropriate chunk sizes, or a noisy knowledge base — no LLM is capable enough to compensate. Retrieval quality is the primary determinant of RAG system quality.

      The four core metrics are: context recall (are the right documents being retrieved?), context precision (is what's being retrieved relevant?), faithfulness (is the answer grounded in the retrieved context?), and answer relevance (does the response address the question?). Evaluation should cover all three pipeline stages — retrieval, augmentation, and generation — independently, using a benchmark dataset that includes real user queries, edge cases, and adversarial examples. Tools like RAGAS provide frameworks for automated evaluation.

      Semantic search retrieves the most relevant documents based on meaning rather than keywords, then stops — it surfaces documents. RAG takes the additional step of using those retrieved documents as context for an LLM to generate a synthesized, coherent response. RAG doesn't just find relevant content; it uses that content to answer a question.

      Yes. RAG is model-agnostic by design. The retrieved context is passed to whatever LLM you're using as part of the prompt. You can use RAG with GPT-4o, Claude, Gemini, Llama 3, Mistral, or any other model that accepts text context. The best RAG systems are built to be LLM-agnostic specifically so they can switch between models without rebuilding the retrieval infrastructure.

      Graph RAG uses a knowledge graph — a structured representation of entities and the relationships between them — as the retrieval source instead of or alongside a vector database. It's particularly effective for queries that require following relationship chains: "Who works for the company that acquired the company whose CEO gave the keynote?" These multi-hop relational queries are exactly what graph traversal handles well and what standard vector similarity search doesn't.

      If you are in finance, healthcare, or tech, then you’ve already been fed enough on the use cases of APIs and how they’re changing the space you’ve been working in.  

      We’re now in a race to ship/build/use AI-powered features. 

      Engineering teams have quietly embraced a new checklist, one that feels uncomfortably familiar to anyone who has watched a production outage unfold in real time.  

      In recent months, as applications have grown into smaller meshes of microservices, third-party integrations, and AI agents talking to other AI agents, the humble API endpoint has become the thing that holds everything together — or doesn’t.  

      Your UI can be flawless and your backend can still be on fire,” Charity Majors, the co-founder of observability platform Honeycomb, has said this more than once. The sentiment has stayed in engineering circles and, of course, on our minds. 

      For developers, this is more like a debate than a daily frustration. Because by the time a bug shows up in the UI, it has usually been quietly hiding in an API for weeks — a missing field, an undocumented error, an edge case that only breaks when two services talk to each other at exactly the wrong moment.  

      The testing setups that once felt good enough — a Postman collection, a handful of curl commands, some manual spot-checks before release are now starting to show their cracks when your system has dozens of endpoints changing every sprint.  

      This is a serious problem, and this has to change. 

      In 2026, shipping without a real API testing practice is like skipping code review: plenty of teams do it, nobody brags about it, and everyone pays for it eventually. 

      The 7 steps at a glance: 

      1. Read the contract before writing a single test 
      2. Set up a realistic, isolated test environment 
      3. Design scenarios across three layers: happy path, negative, edge cases 
      4. Get test data under control to eliminate flakiness 
      5. Validate responses beyond just the status code 
      6. Automate and integrate into your CI/CD pipeline 
      7. Evolve tests for performance, security, and change 

      This guide gives you a practical 7-step framework for testing API endpoints that fits how modern teams actually build and ship software.  

      Along the way, you’ll see where traditional tools are enough, and where intelligent platforms like qAPI start to matter — especially when you’re tired of brittle scripts and constant maintenance overhead. 

      Step 1: Start With the API Contract, Not the UI 

      The first step in API endpoint testing is understanding what the endpoint claims to do — before you open Postman or write a single assertion. 

      For each endpoint, we need to document three things: 

      1. The basics

      • URL, HTTP method, and purpose — for example, POST /users creates a new user account 

      1. Request requirements

      • Which fields are required vs. optional? 

      • What types and formats are expected? (Email strings, ISO 8601 dates, enum values, UUIDs) 

      1. Response models

      • Success codes: 200, 201, 204 

      • Error codes: 400, 401, 403, 404, 409, 500 

      • Response body schema for both success and failure paths — not just the happy path 

      For qAPI users, this is where things get interesting: qAPI can directly read your OpenAPI spec and traffic to infer  what endpoints exist and how they behave. 

      Then suggest a starting set of tests. You’re no longer staring at a blank page trying to write up test cases from scratch. QAPI helps you automate this process entirely. 

      Step 2: Set Up a Realistic Test Environment 

      Good tests in the wrong environment is a misleading step and delays delivery. A test suite that passes against a toy mock but fails in staging isn’t protecting you from anything. So to beat this you need to start with a: 

      A non-production environment Staging, QA, or a dedicated sandbox that mirrors production in configuration. Testing directly on production is asking for data leaks, accidental side effects, or real customer impact. 

      Proper authentication for every role API keys, OAuth tokens, or JWTs for each access level — admin, standard user, read-only service account. Keep test credentials completely separate from real customer accounts. 

      A clear plan for external dependencies Decide upfront: when do you call real third-party APIs (payment sandboxes, SMS providers), and when do you mock or stub to avoid rate limits and flakiness? 

      Logging and observability Access to request logs, error logs, and ideally correlation IDs or trace IDs so you can follow a failing request through microservices. Without this, debugging test failures becomes more like a lucky draw. 

      Step 3: Design Test Scenarios Across Three Layers 

      Most teams stop at “does a valid payload return a 200 with the right JSON?” That’s just increasing your risk appetite — not a test strategy. 

      For every endpoint, you need to think in three layers. 

      Layer 1: Cover Happy Path Scenarios 

      The intended use cases — what the endpoint was built for: 

      • Valid input → correct success status code 

      • Response body matches the expected schema and field values 

      • Side effects happen correctly (database records created, downstream events fired) 

      Example for POST /users: send a valid email and password, assert you get 201 Created, a Location header, and a user object in the body. 

      Layer 2: Negative Scenarios 

      These prove your API fails safely and that the errors are handled intentionally, not accidentally: 

      • Missing required fields → 400 with a clear error message 

      • Invalid formats (malformed email, string where integer expected) → 422 

      • Wrong HTTP method (PUT where only POST is accepted) → 405 

      • Invalid, expired, or missing auth tokens → 401 

      • Business rule violations (duplicate email, conflicting resource state) → 409 

      Each scenario should return the correct error code with a proper error message — not a stack trace, not a 500 that swallows the real problem. Each detail should help us understand the issue, no matter which team handles it. 

      Layer 3: Edge and Boundary Scenarios 

      This is where production bugs hide and where all the major efforts should be diverted: 

      • Minimum and maximum field lengths (what happens at exactly 255 characters?) 

      • Very large payloads (does your API handle a 10MB JSON body gracefully?) 

      • Special characters and unexpected encodings 

      • Values at the exact boundary of a business rule — balance exactly $0.00, age exactly 18 

      • Rate limit behavior: what happens on request 101 when the limit is 100/minute? 

      A useful exercise we recommend for teams is to ask: “What’s the weirdest legitimate value someone could send here — and what’s the most dangerous malicious one?” Generate test cases for those first. 

      Step 4: Get Test Data Under Control 

      Flaky tests are almost always a test data problem. If your test data is shared, stale, or environment-dependent, your test results are unreliable — and an unreliable test suite is worse than no suite at all, because it trains your team to ignore failures. 

      You want data that is representative of real usage, isolated so tests don’t interfere with each other, and repeatable so the same test produces the same result every time. 

      Four practical rules: 

      1. Use fixtures for common scenarios. Store representative JSON payloads in version control alongside your tests. Fixtures are the ground truth for what “valid input” means. 
      2. Parameterize everything environment-specific. Base URLs, auth tokens, and resource IDs come from configuration — never hard-coded into test files. 
      3. Avoid shared state. Each test should create its own data and clean up after itself. If you must share state across tests, build explicit setup and teardown routines and document them. 
      4. Have a reset strategy. Cron jobs or scripts that restore your test database to a known state. Idempotent operations wherever possible. 

      qAPI can discover realistic test data from your existing API traffic and logs, then reuse it in tests. That means you aren’t inventing synthetic payloads that don’t reflect how your API is actually called in the wild. 

      Step 5: Validate Responses — Well Beyond “200 OK” 

      Sending the request is the easy part. The value is in what you assert. 

      Validate at four levels for every scenario 

      1. Status codeIs the code intentional, or just the frameworkdefault? A 200 that should be a 201 is a bug. A 500 that should be a 400 is a worse bug. 
      2. HeadersContent-Type: application/json, security headers, CORS headers, cache-control directives. Headers are easy to neglect andfrequently break clients in subtle ways. 
      3. Response body

      • Schema: required fields present, types correct, no unexpected nulls 

      • Business logic: totals add up, statuses are valid, relationships are consistent 

      • Data hygiene: no internal IDs, secrets, or PII leaking into the response 

      1. Response timeEven a basic assertion — “this core read endpoint must respond in under 500ms” — catches regressions before they reach users. Youdon’t need a full load testing suite to do this. 

      A concrete POST /users happy-path checklist: 

      • Status is 201 

      • Body contains id, email, createdAt 

      • email field exactly matches the submitted value 

      • Follow-up GET /users/{id} confirms the user actually exists in the system 

      Step 6: Automate and Wire Tests Into Your CI/CD Pipeline 

      Manual API testing is fine for local exploration. It’s not a quality strategy. 

      The moment a test lives only in someone’s Postman collection on their laptop, it stops being a safety net and starts being a liability. 

      Structure your test suite into three tiers: 

      • Smoke tests — A small, fast set that runs on every single commit. High signal, low cost. If smoke fails, the PR doesn’t merge. 

      • Regression suite — Broader coverage that runs nightly or on release branches. Catches subtler regressions that aren’t worth running on every commit. 

      • Extended / performance — Full coverage plus timing assertions. Runs pre-release or on a schedule. 

      Wire tests into your pipeline: 

      Trigger Suite
      Every pull request Smoke tests
      Merge to main Smoke + partial regression
      Nightly build Full regression + performance baseline
      Pre-release tag Full suite + extended security checks

      Make failures visible and actionable: 

      • Test reports with clear pass/fail status, logs, and the exact request/response that failed 

      • Slack or Teams alerts when critical suites fail — not just a red CI badge that people learn to ignore 

      • Defined ownership: someone specific gets paged when an API test breaks 

      qAPI is built to plug into this pipeline layer. Because it’s change-aware, it tells you not just that a test failed, but which endpoints changed and which tests are now affected — so you’re triaging the right thing, not chasing false alarms. 

      Step 7: Evolve Your Tests for Performance, Security, and Change 

      API testing isn’t a project with a finish line. APIs change, risks change, and your tests need to keep pace — or they decay into expensive noise. 

      Add performance awareness 

      • Track p50/p95 response times for critical endpoints over time — not just point-in-time snapshots 

      • Define simple SLAs: “GET /orders/{id} must respond in under 300ms in staging” 

      • Alert on timing regressions after deploys or infrastructure changes 

      Full load testing (k6, JMeter, Gatling) belongs in a separate suite, but even basic timing assertions embedded in your functional tests catch expensive regressions early. 

      Add security basics 

      You don’t need a dedicated security engineer to cover the fundamentals: 

      • Missing or invalid auth tokens return 401 — not 200, not 500 

      • Users cannot access each other’s data (test this explicitly across roles — don’t assume authorization works) 

      • Simple injection payloads or malformed JSON return safe error messages, not stack traces or database errors 

      Use past incidents and findings from your security team as seeds for new negative test cases. Every bug that hit production should become a regression test. 

      Stay change-aware 

      New fields, new status codes, new flows — all of them require: 

      • Updating your endpoint profiles from Step 1 

      • Adjusting test data and scenario assumptions 

      • Adding tests for new failure modes 

      The real challenge is that no team has time to manually audit every endpoint after every change. This is where automated contract monitoring earns its keep. qAPI watches for changes in API behavior and contracts, highlights unexpected drift, and helps you update tests without starting from scratch. 


      The Complete Framework: At a Glance 

      Step What you do What you prevent
      1. Contract Profile each endpoint's inputs, outputs, and status codes Testing against wrong assumptions
      2. Environment Isolated staging with real auth and observability False confidence from toy mocks
      3. Scenarios Happy path, negative cases, and boundary conditions Bugs that only surface under unusual conditions
      4. Test data Fixtures, isolation, and a reset strategy Flaky tests from shared or stale state
      5. Validation Status code, headers, body schema, response time Bugs hiding behind a 200 OK
      6. CI/CD Automated suites triggered on every change Manual testing gaps and late-stage catches
      7. Evolution Performance baselines, security checks, contract monitoring Test suites that rot as the API grows

      If your current workflow is “a handful of Postman collections, some CI jobs, and a lot of manual cleanup,” this framework is your roadmap out of that.  

      And if you want to see what it looks like when a platform handles the hardest parts — maintenance, change detection, and intelligent test generation — that’s when it’s worth seeing qAPI in action on your own endpoints. 

      FAQs

      Begin by understanding the contract for that endpoint: note its URL and HTTP method, which fields are mandatory or optional, the expected request and response formats, and the success and error status codes described in your API spec or documentation.

      Prioritize endpoints that are mission‑critical (payments, login, core user actions), customer‑facing, or tied to recent bugs and outages, then gradually extend coverage to less risky or internal endpoints.

      In addition to the status code, check key headers (such as Content-Type), the response body structure and required fields, data types and ranges, business logic (like totals and states), and whether the response time stays within acceptable limits.

      Keep tests independent, use predictable test data and configuration, mock or stub unstable third‑party services, rely on condition‑based checks instead of fixed waits, and regularly clean up or rewrite tests that fail intermittently.

      Run a fast smoke set of crucial endpoint tests on every pull request, a larger regression suite on main or pre‑release builds, and full or heavier checks (including performance or security tests) on scheduled runs in a staging environment, all automated through your pipeline.

      Think about how many times your apps call an API today.  

      Every login, every payment, every dashboard refresh for any application that you use — it’s all APIs talking to each other behind the scenes. Most apps in 2026 now rely on 26-50 APIs just to function, and when even one of those breaks, the whole experience can fall apart. 

      This isn’t a small corner of software development anymore. It’s the backbone of it. The API testing market itself is growing fast — most analysts put it somewhere between $1.7 billion and $2.85 billion in 2026, with growth rates ranging from 12% to over 20% a year depending on how you measure it. However you slice the numbers, the direction is the same: more APIs, more testing, more pressure on teams to get it right.

      Cost of Downtime

      But here’s the catch. We’ve gotten really good at running API tests. qAPI, Postman, REST Assured, Karate, Playwright, k6 — there’s no shortage of tools to fire requests and check responses. What we haven’t gotten good at is understanding what those tests are actually telling us.  

      Have you thought about it? 

      The market is aggresively racing toward AI-generated tests and complex microservice setups where one request might bounce through a dozen services — yet when something breaks, most teams are still stuck reading raw XML files in Jenkins or staring at a CLI log that tells them nothing useful. 

      And that gap is expensive. Downtime costs have climbed sharply in the last couple of years. Recent industry surveys put the average cost of downtime well above $5,000 a minute for mid-sized businesses, with some large enterprises now reporting figures north of $14,000 a minute when core systems go down.  

      When something breaks when the product/application is live, the question your team faces isn’t just “did the test pass?” It’s “why didn’t we catch this?” More often than not, the answer is hiding in a reporting gap — your tests ran fine, your pipeline went green, but nobody could actually see what happened. 

      What teams need isn’t another test runner; our users have clearly mentioned that. It’s visibility — reporting capability that can turn raw logs into something a human can actually act on. Because a test that runs without being understood is just a fast way to feel safe while flying blind. 

      Let’s walk through exactly where that gap shows up. 

      Why is production on fire, even after multiple test runs? 

      That green checkmark in Jenkins, GitLab, or GitHub Actions feels great. All tests passed — deploy it, right? 

      Here’s the part nobody wants to admit: a passing test doesn’t mean a correct API. 

      Most basic reporters — Newman’s default output, plain JUnit reports, even some paid tools — treat “no error was thrown” as “everything is fine.” But APIs can be sneaky.  

      A 200 OK response can still mask a broken payload, a quietly removed field, or business logic that fails without ever throwing an exception. Your test checked the status code. Your testing strategy didn’t probably check whether order_total is still a number instead of a string, or whether user.subscription_status still matches the values your app expects. 

      What you’re left with is a simple pass/fail grid with no detail on the actual payload, no sense of whether the response makes real-world sense.  

      In a system built from dozens of connected services, one small field change can ripple into several broken features downstream. A dashboard that doesn’t catch this isn’t just unhelpful — it’s quietly dangerous, because it only breaks the illusion once something starts costing money. 

      Why does debugging one failed test take a lot of time? 

      A test fails. You click into it. The message reads something like AssertionError: expected 200 to equal 200. That’s confusing — probably a typo in the test itself. You rerun it. Now it says Error: Request failed with status code 500. Okay, but why? 

      So the search begins. You open your logging tool. You scroll through the test runner’s raw output. You check the application logs. You ask your infrastructure team if staging was mid-deployment at the exact time the test ran.  

      Then you’re hunting for a request ID that your test framework might have logged — but probably didn’t, because most reporters only capture the assertion failure, not the request headers, payload, or response time that actually caused the problem. 

      The real issue here is traceability.  

      Most API test reports treat each test like a black box: input goes in, a true/false comes out. But an API call is really a conversation — headers, payload, timing, retries, and the services it touches along the way.  

      According to my research, a good report should follow that entire journey. Instead, most tools hand you a one-line message like “Step 3 failed” and leave you to reconstruct the rest on your own. 

      Users can’t see what happened in last Deployment Test Run? 

      “Check the pipeline logs,” your teammate says. So you click through several screens in GitHub Actions, download a zip file, open an old XML report… and find out the retention period expired. It’s gone. 

      API test results tend to disappear fast in most organizations. CI/CD tools are built to move code forward — not to act as a history book for test results. You can see whether today’s build passed, but comparing it to a build from two weeks ago is often impossible.  

      Spotting that one endpoint has been getting slower over the past month, or that a particular test fails 12% of the time — usually only on Tuesdays — requires data that simply isn’t there anymore. 

      This matters because patterns tell you more than single results do. One failure is just a data point. A string of failures over time is an insight. But if your test history is tied to your CI pipeline’s storage limits, that insight disappears the moment logs roll over. Nobody would accept a monitoring dashboard that only shows the last hour of data — so why do we accept the same limitation in test reporting? 

      How do I know if It’s a real bug or an unstable environment? 

      You run your test suite. Three tests fail. You run it again — a different three fail this time. You check your environment dashboard and notice staging’s Redis instance is sitting at 97% memory, again. You restart the environment, rerun the suite, and everything turns green. 

      At that point, do you even trust the result anymore? Probably not — and you shouldn’t have to guess. 

      Most reporting tools have no idea what environment context even means. A failure in staging gets the same red flag as a failure in production, even though one might be a known infrastructure quirk and the other could be costing you revenue right now.  

      There’s no baseline that says “this endpoint usually responds in 120ms here, but today it took 4 seconds,” and no note that says “the auth service was down for maintenance during this run.” 

      When everything looks equally critical, nothing actually is — and teams quietly start ignoring their reports because there isnt anything that can be done there. That’s exactly how real problems slip through, buried under noise from an environment that wasn’t even stable to begin with. 

      Why am I taking Screenshot of my terminal to explain this to QA? 

      You’ve got the test report open. It’s a wall of plain JSON, or an XML file that only displays properly in an old browser, or a CLI table that wraps awkwardly in Slack. So you take a screenshot, circle the important bit in red, and send it over. 

      That shouldn’t be how this works. 

      API testing is a team effort. Developers write the tests, QA checks the behavior, product managers care about whether the business logic holds up, and engineers responsible for reliability care about latency.  

      But most reporting tools are built only for the person who wrote the test — not for anyone else who needs to understand the result. There’s usually no shareable link, no view tailored to different roles, and no way to leave a comment on a specific failed check. 

      This creates an awkward problem for teams: the person who wrote the test becomes the only one who can explain it, because the report itself doesn’t speak to anyone else. In an industry that talks constantly about collaboration and “shifting left,” test reporting often remains a one-person job. This clearly needs to change. 

      How did a broken schema change make it to production if our tests passed? 

      A mobile app starts crashing in production because the API stopped returning the profile_image_url field. But the tests? All green. Digging into the report, you realize the test only checked for a 200 OK and confirmed user_id was present — it never validated the full response structure.  

      Here maybe there was a separate schema check somewhere, but it was in a sub-report that no one looked at, while the main dashboard stayed green because the functional checks passed. 

      This is schema drift — and most reporting tools are blind to it. APIs change shape constantly: fields get removed, nested objects get restructured, types shift. Unless your report flags a schema mismatch with the same urgency as a failed assertion, it’s easy to miss entirely.

      GET user 123

      Tools like Pact and JSON Schema validators exist for exactly this reason, but they often live in separate reports, disconnected from the main test dashboard. qAPI solves that by providing it all in one place.  

      For any system where mobile apps, partner integrations, or frontend apps depend on a stable response shape, that diff isn’t a nice extra — it’s the whole point of testing in the first place. 

      Why do I need two different tools to know if my API works and scales? 

      Your functional tests run in REST Assured or Postman — green. Your load tests run separately in k6 or Gatling — also green. But they live in completely different dashboards, and never talk to each other. 

      So when GET /inventory starts timing out under heavy load, your functional report has nothing to say about it. And when a bug causes a memory leak that only shows up at high traffic, your load test report just shows “high latency” — with no hint that it’s because a missing pagination parameter let the response payload balloon from 2KB to 20KB. 

      This is the bifurcation problem — the split between functional and performance testing means you never see how they connect. You can’t easily spot that the endpoint with the worst latency under load is the same one that had a schema change last week.  

      Right now, someone on your team is probably doing that correlation manually, in a spreadsheet. A good reporting tool should be doing that automatically. 

      Is there a way to see all of this without needing a computer science degree? 

      Yes — and this is where qAPI comes in. Not as a hard sell, but because it was built around one simple idea: if it takes more than two clicks to understand why a test failed, the dashboard has already failed you. 

      Here’s what that looks like in practice. 

      Everything in one view. Open the dashboard and see status, schema validation, latency trends, and environment tags together — no jumping between separate “functional” and “performance” tabs. If POST /checkout passes functionally but is suddenly slower than usual, you see that warning right next to the green checkmark, with the context to understand why. 

      History that shows your pipeline. qAPI keeps test history independent of your CI storage limits. You can compare today’s run against one from three months ago and see, for example, that GET /user has been getting slightly slower every week. Your CI/CD pipeline runs the tests — qAPI remembers what they meant over time. 

      Environment-aware reporting. Tests are tagged by environment, and each one builds its own baseline. If staging always slows down at 9 AM due to a backup job, qAPI learns that pattern and flags genuine problems rather than repeating the same false alarm. 

      Failure details, not just failure messages. Click on a failed test and see the full picture — request headers, payload, response body, timing, and a clear diff of what changed: which field disappeared, what value was expected versus what came back. No more digging through five different logs to reconstruct the story. 

      Built for the whole team. Share a link, and everyone sees the view that matters to them — QA gets the validation history, product managers see the business flow, and engineers see the latency spike. Same test run, different perspectives, no screenshots needed all in real-time. 

      Schema checks front and center. A missing or changed field shows up in the same place as a failed status code check — not buried in a separate report nobody opens. 

      Detailed, but not overwhelming. The goal isn’t to simplify the data away — it’s to organize it. You see everything that matters, laid out clearly, without digging for it. 

      The Bottom Line 

      Over the last decade, the industry has gotten remarkably good at running API tests — better frameworks, smarter mocks, faster pipelines. But somewhere along the way, reporting got left behind, stuck looking like a debug log from a different era. 

      You shouldn’t need to open five different tools to understand why something failed. You shouldn’t need to write custom queries against your CI artifacts just to see a trend. And your whole team — not just the person who wrote the test — should be able to read the result and understand what it means. 

      Your API tests already have the answers. The only question left is whether your reporting lets you see them.

      FAQs 

      Q: Postman and Newman work fine for my team — what’s actually missing? Postman is a great API client, and Newman is a solid way to run tests from the command line. But their reporting is built around execution, not understanding. You get raw output, not history, environment context, or schema drift detection. If you’re manually parsing HTML reports to figure out what went wrong, the tool is working for you the wrong way around. 

      Q: Couldn’t I just build this myself with Grafana, Elasticsearch, and some scripts? Technically, yes. If you’ve got months of engineering time and someone willing to maintain it long-term, it’s doable. Most teams find that this kind of DIY reporting setup quietly becomes its own project — with its own bugs and upkeep. QAPI gives you that visibility without the ongoing maintenance. 

      Q: How is this different from Allure Report? Allure is a well-known and well-built tool for visualizing test steps within a test framework. But it doesn’t know much about your environment health, your API’s schema contracts, or trends across different CI runs over time. QAPI is built specifically around APIs and their context — not just around individual test frameworks. 

      Q: Does it work with my existing CI/CD setup? Yes. QAPI fits into Jenkins, GitHub Actions, GitLab CI, CircleCI, or whatever you’re already using. It reads your test results — it doesn’t replace your test runner. You keep your existing stack and just stop losing the insights. 

      Q: What about data security — are my API responses stored in the cloud? QAPI supports both cloud and self-hosted setups. If you’re working with sensitive data, you can host it on your own infrastructure. For cloud deployments, data is encrypted both in transit and at rest, with retention settings you control. Sensitive fields and personal data can be masked before anything leaves your network. 

      Q: Does it support GraphQL and gRPC, or just REST? REST is still the most common starting point, but modern teams are increasingly working with GraphQL, gRPC, and WebSocket-based APIs too. QAPI’s reporting model is built to handle these different transport types, not just traditional REST endpoints. 

      Q: Is keeping months of test history actually worth it? Yes — and this is backed by how these problems actually show up. Flaky tests rarely reveal themselves in a single run. Performance regressions build up slowly. Schema drift happens gradually, one small change at a time. Historical data is what turns your test suite from a simple pass/fail gate into something that can actually diagnose problems before they become incidents. 

      Large Language Models (LLMs) are everywhere and now in 2026 we don’t think you can survive the tech space without knowing a tool or two that runs on AI. The AI led tech is now powering customer support chatbots, code assistants, content generation, legal research, medical summarization, and more.  

      But here’s the problem with it. With evaluation news dominating headlines and new benchmarks dropping almost weekly with models like ChatGPT, Minimax and Claude 4 etc creating and pushing new boundaries, and enterprises quietly panicking about hallucinations in production. 

      Because they are unable to choose the best pick for their product, as there are a lot of failures and guesswork that you’d probably don’t want to deal with.  Let’s just say for a new mobile application you wouldn’t ship the app without performance testing, security scans, and real-user simulation. Yet thousands of teams are deploying Large Language Models in customer-facing tools, virtual AI assistants, and decision systems with little more than a gut feeling and a few cherry-picked examples. 

      This guide breaks down exactly what an LLM evaluator is, why the industry is suddenly obsessed with LLM evaluation, and how platforms like qAPI are making it easier to handle it. 

      Let’s dive in. 

      So, What Are LLM Tools, Really? 

      At it’s core, LLM tools are platforms, frameworks, or APIs that let you harness large language models for real work: generating content, answering questions, summarizing documents, classifying text, writing code, extracting entities, and more. 

      LLM Tools

      Popular examples include: 

      • OpenAI’s GPT series (via API) 

      • Anthropic’s Claude 

      • Minimax 

      • Google’s Gemini 

      • X AI’s Grok 

      and the list goes on. 

      These tools usually expose a simple text-in/text-out interface, but underneath they’re massive statistical pattern matchers trained on trillions of tokens. 

      What Is an LLM Evaluator? 

      An LLM evaluator is a framework designed to measure the capabilities how good (or bad) a large language model performs on specific tasks, datasets, prompts, or real-world use cases. 

      It’s not like traditional software testing (where outputs are deterministic), LLM evaluation deals with probabilistic, generative systems — so you’re not just checking correctness, but also: 

      – Faithfulness — does the answer stick to provided context / facts? 

      – Relevance — is it actually answering the question asked? 

      – Safety — does it avoid harmful, toxic, or jailbreak content? 

      – Consistency — same prompt → reasonably similar answers over time? 

      – Helpfulness / Coherence — is the tone, structure, and depth appropriate? 

      – Authenticity — is factual information supported by sources? 

      – Efficiency — latency, token cost, throughput under load 

      So How to Pick the Best LLM Tool 

      How to Pick the Best LLM Tool

      Step 1 – Pre-Deployment: Define Decision Criticality 

      You need to understand that not every LLM use case carries the same risk weight. 

      A content-summarization assistant for internal memos is not the same as an LLM that recommends credit limits, flags suspicious transactions, or drafts regulatory disclosures. The first step in any enterprise evaluation program is to map the AI use case against a decision criticality framework. 

      Decision criticality is determined by three factors: 

      •  Reversibility — Can a wrong answer be caught and corrected before harm occurs? 

      •  Regulatory exposure — Does the domain fall under consumer protection, fair lending, data privacy, or financial crime rules? 

      •  Downstream consequence at scale — What happens if systematic error affects thousands or millions of decisions? 

      Quick mapping of common enterprise use cases: 

      Quick mapping of common enterprise use cases:
      Use Case Reversibility Regulatory Exposure Scale Consequence Criticality Level
      Internal content summarization High Low Low Low
      Customer support chat Medium Medium Medium Medium
      Automated contract clause extraction Medium High High High
      Regulatory exception flagging Low Very High Very High Critical
      Credit / insurance underwriting Low Very High Very High Critical

      What you need to keep in check here is that every proposed LLM use case has to be scored against this framework before any pilot begins.  

      High-criticality and critical applications must have mandatory human-in-the-loop review gates, full audit trails, and documented evaluation protocols before production deployment is approved. 

      Step 2 – Stress-Test for Hallucinations & Bias 

      Hallucination is one of the top #1 operational risk in decision-critical LLM deployments. 

      When an LLM confidently cites a non-existent regulation, invents a clinical contradiction, or applies an incorrect factor, it does not raise a red flag.  

      It simply continues. Gartner notes that organizational data not seen during training often exposes quality collapse exactly where high-stakes decisions are made. 

      Gartner clients have reported that when organizational data not accessible during LLM training is introduced, model responses are often not of benchmarked quality. [1] This is precisely the condition under which high-criticality decisions are made.  

      Stress-testing must cover three dimensions: 

      •  Factual accuracy — Does the model anchor answers to verifiable, retrievable sources, or does it confabulate from statistical patterns? 

      •  Demographic bias — Do outputs vary systematically across protected characteristics in ways that create discriminatory outcomes? 

      •  Adversarial robustness — Does behavior remain stable under edge-case inputs, prompt injection, jailbreak attempts, or semantically ambiguous queries? 

      For credit, lending, insurance, and regulatory reporting applications, bias testing is not optional—it is legally required under the Equal Credit Opportunity Act, Fair Housing Act, GDPR fairness principles, and equivalent frameworks globally. 

      qAPI Suggests: Create a rule to document bias and hallucination testing methodology and results as part of the compliance audit record. Use multiple datasets and red-teaming protocols appropriate to the domain. 

      Step 3 – Scenario Validation Against Real Business Reality 

      Benchmark scores are marketing material, not deployment credentials. 

      The decisive evaluation step is running the model against scenarios drawn directly from your operational reality: production-representative data, realistic query distributions, and edge cases surfaced by domain experts. 

      For regulatory reporting, that means testing against your actual filing formats, jurisdictional terminology, and exception conditions. For contract analysis, it means validating against the clause structures, governing law variations, and random language patterns in your real portfolio. 

      These general-purpose benchmarks don’t always reveal the failure modes. It only appear when your own data enters the system. 

      What we suggest is you start by maintaining a “golden dataset” — a selected library of production-like queries paired with expert-validated ground-truth answers. This dataset should be continuously expanded with live deployment data, creating a self-improving evaluation asset. 

      For every high-criticality use case, you must demonstrate that outputs can be traced to identifiable reasoning steps or source documents—not accepted as black-box conclusions. This creates the technical foundation of audit-trail infrastructure. 

      Step 4 – Post-Deployment: Continuous Monitoring 

      Evaluation is not a one-time gate. We think it’s quite evident. 

      LLMs in production are more likely to model drift — output quality degrades as real-world data distributions evolve away from training conditions. A model validated at launch can behave marginally differently six months later, without any code change. The trigger is the world changing around it. 

      Continuous monitoring requires three capabilities: 

      •  Automated tracking against the golden dataset 

      •  Alerting on response quality anomalies (factual drift, tone shift, format inconsistency, increased refusal rate) 

      •  Structured human review pipelines that feed expert feedback back into revalidation cycles 

      Leading organizations treat LLM monitoring like financial controls: not a single annual audit, but continuous assurance with documented evidence available on demand for regulators and auditors. 

      Here’s what we suggest  

      Define a recurring re-evaluation cadence triggered by model updates, data distribution shifts, or regulatory changes.  

      qAPI can operationalize this at enterprise scale — providing automated AI validation, continuous testing pipelines embedded in CI/CD, and governance dashboards that track model performance and decision reliability over time. 

      What You Need To Understand: Not all LLM outputs are created equal. 

      One prompt can give you brilliant insight; the next (same model, slightly different wording) can hallucinate confidently wrong facts, leak sensitive data, or produce biased, unsafe, or off-brand content. 

      That’s where LLM evaluation becomes important for you and your teams. 

      Here’s how this section would look if it were written to feel more human, more valuable, and stronger for search + LLM ranking — less like product documentation, more like something people actually want to read and trust. 

      Evaluating LLMs Using qAPI 

      Most teams don’t struggle with using LLMs. They struggle with trusting them. You try using one tool get used to it, only to realize that an update later you’re out on the streets looking for a new tool to get your work done in time and the right way. 

      At the start, evaluation feels simple. You test a few prompts. Check the responses. Maybe compare outputs across models. 

      Everything looks fine. But as soon as you try to scale, things break. This is where you should start asking: 

      •  How do we know this won’t fail in production? 

      •  What happens when the model gives a confident but wrong answer? 

      •  How do we test real-world impact, not just sample prompts? 

      •  And how do we keep checking performance over time? 

      This is where most teams stop and look around in confusion. 

      Because LLM evaluation is not just about testing outputs. It’s about building a system that can continuously validate behavior. 

      That’s exactly the gap qAPI’s LLM evaluator is built to solve. 

      What qAPI Actually Does 

      What qAPI actually does

      It helps you answer one simple question: Can we trust this model in production?” 

      It does this by turning LLM evaluation into something that is: 

      •  structured 

      •  repeatable 

      •  and scalable 

      Instead of writing scripts or managing multiple tools, teams can: 

      •  test models 

      •  validate prompts 

      •  run benchmarks 

      •  monitor performance 

      —all in one place. 

      Let’s walk through how this works: 

      1. CoversWhat Really Matters 

      Before running any tests, teams need clarity. Not every LLM use case has the same risk. 

      A chatbot answering FAQs is very different from: 

      •  a system suggesting financial decisions 

      •  or generating compliance reports 

      qAPI helps teams define: 

      •  what “good output” looks like 

      •  how accurate the model needs to be 

      •  where human review is required 

      This step is important because it aligns evaluation with business impact, not just technical metrics. 

      1. Goes BeyondGeneric Benchmarks

      A lot of teams rely on benchmarks like MMLU. 

      They’re useful — but they don’t tell the full story. 

      Because your model doesn’t operate in a benchmark. 

      It operates in your product. 

      qAPI allows teams to test: 

      •  real prompts from users 

      •  industry-specific scenarios 

      •  edge cases that actually matter 

      For example: 

      •  finance teams can test real query patterns 

      •  support teams can simulate customer conversations 

      •  legal teams can validate contract analysis outputs 

      This is where evaluation becomes practical, not theoretical. 

      1. Scale Testing Without Scaling Effort

      Manual testing works… until it doesn’t. 

      Once you have hundreds of prompts, multiple models, and different use cases, things get messy fast. 

      qAPI automates this process. 

      Teams can: 

      •  run thousands of test cases 

      •  compare outputs across models 

      •  evaluate functionality in minutes 

      What used to take days now happens in a single run. 

      This is often the point where teams realize: 

      Evaluation doesn’t have to slow them down anymore. 

      1. Get Reports That You Actually Understand 

      One of the biggest frustrations in LLM testing is this: You get outputs… but no clear insight. 

      You’re left wondering: 

      •  Where is the model failing? 

      •  Is this a one-off issue or a pattern? 

      •  What should we fix first? 

      qAPI solves this by turning raw outputs into: 

      •  structured reports 

      •  functional breakdowns 

      •  Gives a rating for the LLM tool 

      So Instead of guessing, teams can clearly see: 

      •  weak areas 

      •  inconsistent behavior 

      •  high-risk scenarios 

      This makes improvement faster and more focused. 

      1. HelpsEvaluate After Deployment 

      Here’s something most teams underestimate: 

      LLM performance changes over time. 

      Even if the model stays the same: 

      •  user inputs evolve 

      •  data changes 

      •  edge cases increase 

      This leads to silent degradation. qAPI helps teams stay ahead of this by: 

      •  Tracking performance continuously 

      •  Detecting drift in outputs 

      •  Re-running evaluations with updated data 

      This turns evaluation into a continuous safety layer, not a one-time checkpoint. 

      What Changes When Teams Use qAPI 

      When teams move to a structured evaluation system, the difference is clear. 

      Before the tools are scattered you need too much manual effort and even then, the releases dont feel confident. 

      But with qAPI you get centralized workflows, automated testing and complete clear performance visibility 

      Teams will benefit with faster evaluation cycles, better coverage of real-world scenarios and the best part: earlier detection of issues. 

      But the biggest upside to this: You can make a right decision. 

      A year ago, the question was: “Which model should we use?” Today, the real question is: “Which model can we trust?” 

      Because access to powerful models is no longer the advantage. 

      How you test, monitor and how quickly you catch failures will make all the difference in 2026 

      Final Thoughts 

      LLM evaluation isn’t a good start it’s a wise start. 

      The organizations that will lead in enterprise AI over the next decade won’t necessarily be the ones with access to the most powerful models (that edge is commoditizing fast). They will be the ones that can: 

      – Deploy generative AI responsibly   

      – Sustain performance reliably over time   

      – Demonstrate integrity and compliance credibly to regulators, auditors, and boards   

      Structured, continuous LLM evaluation is now a best bet for high-stakes use cases. It is the minimum viable control framework needed to manage real financial, legal, and reputational risk. 

      The four steps outlined here—defining decision criticality, stress-testing hallucinations and bias, validating against real business scenarios, and implementing continuous monitoring—are not aspirational best practices. They are the operational baseline any prudent risk leader or CIO should demand today. 

      The question isn’t whether your organization can afford to build this evaluation discipline.   

      It’s whether you can afford not to—while competitors quietly reduce their exposure, accelerate safe adoption, and gain regulatory and market trust you’re still trying to earn. 

      In regulated and consequential domains, trust is no longer granted.   

      It is proven—every day, in production, under scrutiny. 

      qAPI exists to make that proof systematic, auditable, and scalable—so you can move fast without moving recklessly. 

      The future belongs to the organizations that treat evaluation as seriously as they treat innovation.   

      Which side will yours be on? 

      If you’re ready to move from “it seems fine” to “we know it’s reliable”, start with qAPI. 

      [Start your free trial] 

      What’s your biggest pain point with LLM evaluation today?   

      Manual reviews? Hallucinations slipping through? Regression surprises?   

      Drop it in the comments — we read every one. 

      References 

      1.Agarwal, S. (2025). How to Select the Right Large Language Model. Gartner Research Note G00794364.  

      If your organization has more than a handful of services, you’ve probably seen this movie: 

      A field name changes from customerId to clientId. 

      •  Service A’s local tests pass 

      •  CI pipelines stay green. 

      •  Deployments proceed normally 

      Then, days later: 

      •  Service B’s integration layer starts failing. 

      •  Error rates start to climb 

      •  Customer-facing systems degrade 

      •  Incident response begins 

      The issue wasn’t broken code. It was a broken contract. 

      This is one of the most common reliability failures in that we see in microservices architecture, and it exposes a critical weakness in how many teams still approach integration testing. 

      It’s because unit tests are too local to see cross‑service impact. In 2026, you need something in the middle that can keep up with microservices, third‑party APIs, and AI‑generated changes. 

      But contract testing today is no longer limited to API validation strategy. In practice, it has turned into a basic reliability mechanism for teams managing independently deployed services, external integrations like Stripe or Twilio. And increasingly, AI-generated code changes that can introduce regressions faster than traditional QA processes can document them. 

      For organizations adopting platforms including qAPI or using agentic testing systems, contract testing becomes even more powerful by automating large portions of validation and change detection. 

      Treat Contracts as “APIs for Your APIs” 

      Most teams treat OpenAPI specs as documentation. Contract testing treats them as executable promises. If a contract says: 

      “If you call GET /orders/{id} with X, I promise to respond with Y status codes and a body that at least has id, status, and totalAmount shaped like this…” 

      If we’re being precise: 

      •  The provider promises: 

             •  These HTTP methods and paths exist. 

             •  For these inputs, you’ll get these outputs (status, headers, shape). 

      •  The consumer promises: 

             •   “I will only rely on these parts of the response, in these ways.” 

      Contract testing verifies both sides so that consumers don’t depend on things that were never promised. And providers don’t silently break what consumers rely on. 

      In practice, this will give you two big things: 

      1. You can move faster because you can see whether a change is safe before deploying. 
      2. You reduce the need for brittle, full‑stack “everything talking to everything” tests. 

      Why Integration Testing Alone Isn’t Enough Anymore 

      Let’s take a realistic example: 

      •  You’ve got 50+ microservices. 

      •  Some are owned by different teams; some are legacy; some are AI‑driven. 

      •  You also rely on external APIs (payments, KYC, AI, messaging). 

      To “fully” test this with classic integration tests, you will need: 

      •  All services online and running. 

      •  Realistic seed data. 

      •  Stable test data in third‑party sandboxes. 

      •  Flows that manage 5–10 services in one go. 

      To fully test this architecture with classical integration testing, you would need all services running across potentially different stacks, realistic seed data which reflects production behavior, stable test data in third-party sandboxes, and end-to-end flows traversing five to ten services in a single test case. 

      You might manage a few critical scenarios this way, but you cannot cover every consumer variant across 50 services, every minor field change, or every failure mode and edge case without enormous infrastructure cost and maintenance cost. 

      The result is a pattern that most teams recognize immediately: 

      pattern that most teams recognize

      •  Unit tests are trusted because they are fast and isolated 

      •  Staging environments are sort of trusted because they look like production 

      •  Integrations are quietly hoped to be fine because “we didn’t touch that part” 

      This is how subtle contract breaks survive all the way to production, the point we’re trying to expose. 

      Microservices contract testing is about shortening that feedback loop and making service-to-service integrations first-class test targets. And not in a way that side effects are discovered during a three-hour end-to-end run. 

      Consumer‑Driven Contracts Is The Only Thing That Scales 

      At small scale, a provider-driven approach will feel reasonable. Because the provider publishes an OpenAPI spec, consumers read it, everyone adapts. At 30 to 50 services, this model will fail and experience problems. 

      Why? Because each consumer: 

      •  Uses a subset of fields. 

      •  Cares about specific edge cases. 

      •  Has its own tolerance for a change. 

      This is how consumer‑driven contracts work in practice. Let’s imagine an Orders API consumed by: 

      •  Web frontend. 

      •  Mobile app. 

      •  Billing service. 

      •  Analytics pipeline. 

      Each consumer writes tests that encode: 

      •  The request they sent. 

      •  The reply they expect: specific fields, formats, and rules. 

      For example, the billing service writes: 

      When I call GET /orders/{id} as a system user, I expect: 

      •  Status 200. 

      •  currency present and an ISO 4217 code. 

      •  totalAmount as a number, not string. 

      •  status  {PAID, REFUNDED}. 

      When those consumer tests pass, the generated contracts are published to the broker. The Orders API team then pulls all consumer contracts and runs a provider contract verification suite that replays every consumer expectation against the actual API. If a developer ships a change that drops currency or silently renames totalAmount, verification fails before deployment reaches any shared environment. 

      Now scale that across dozens of services: the provider can see, in one place, exactly what each consumer relies on, and whether a change is safe. 

      What We Don’t Talk About 

      If contract testing for microservices were as simple as adding a library and running tests, adoption would be universal. But in reality, the implementation problem is quite real and worth naming directly. 

      Contracts die when no one owns them. Without clear ownership, contracts will move away from actual behavior, they will multiply into hundreds of tiny interactions that nobody understands, and gradually encode internal implementation details that change frequently. 

      Keeping contracts aligned with real traffic requires deliberate tooling and process. 

      CI/CD integration adds pipeline complexity. The basic flow sounds clean on paper — consumers run tests, publish contracts, providers verify against them, pipelines stay green. In practice, getting this to work reliably across multiple teams and repositories takes real effort. Version compatibility alone can become a rabbit hole. 

      And when things go wrong, pipeline failures often feel random rather than useful. That is usually the fallback moment when teams quietly start skipping the whole approach and go back. 

      Third-party and AI API testing presents a different challenge entirely. If you do not control when a payment vendor deprecates a field or when an AI inference API begins returning slightly different response shapes. You cannot spin up their provider locally for standard verification workflows.  

      A typical consumer-driven pattern does not map cleanly to external dependencies — and yet these are precisely the integrations where behavioral drift is most dangerous and least visible. 

      These are the exact stages where a contract break can take down a checkout flow or silently corrupt your downstream data. And yet they are the ones most teams leave unguarded because the tooling does not fit as you or your team wanted. 

      The good news is that all three of these problems are solvable with the right process and platform support. The next section covers how to build a setup that holds up under real conditions — not just in a demo. 

      A 7‑Step, 2026‑Ready Contract Testing Playbook 

      Contract Testing Playbook

      Less talking about the problems. Now we’ll help you build a more realistic flow you can implement in your stack, and see how qAPI can make your life easier. 

      Step 1: Pick your first contracts wisely 

      You don’t have to start with every API. Start with: 

      •  High‑blast‑radius services (auth, payments, orders, onboarding). 

      •  Painful integrations (recent incidents, frequent changes). 

      •  Third‑party dependencies that are business‑critical for your process. 

      So define a goal like: 

      “We want to ensure payments, orders, and ledger services can change without silently breaking each other.” 

      Step 2: Define contracts at the right level 

      For each integration: 

      •  Identify business‑level interactions, not low‑level HTTP noise. 

      For example, instead of 20 tiny contracts for GET /orders, define 3–5 real scenarios: 

      •  Fetching a paid order for billing. 

      •  Fetching a pending order for UI. 

      •  Fetching a refunded order for analytics. 

      Each scenario: 

      •  Includes the minimal set of fields that consumer actually uses. 

      •  Includes constraints that really matter (types, non‑null fields, enums). 

      •  Avoids over‑specifying internal fields that might change often. 

      Intelligent API testing platforms can accelerate this step considerably by analyzing real traffic and inferring which fields each consumer actually relies on, rather than requiring teams to guess from documentation. 

      Step 3: Encode consumer expectations close to consumer code 

      For each consumer you must: 

      •  Add a contract testing suite in the same repo as the consumer. 

      •  Use language‑appropriate libs (Pact etc.) or your own test harness. 

      •  Test against a mock/simulated provider—not the actual API. 

      The key is: consumer tests become living documentation of how they use the provider. They should run on every PR for that consumer. 

      With qAPI, an agent can: 

      •  Observe which calls the consumer actually makes. 

      •  Propose/update those contract tests when new patterns emerge. 

      •  Flag when consumer code starts relying on a previously unused field. 

      Step 4: Establish a contract registry (broker or equivalent) 

      Contracts are useless if they live only in a single repo. 

      You need: 

      •  A central place where contracts are published and versioned. 

      •  Metadata: which consumer, which version, which environment. 

      •  A way for providers to query “what do my consumers expect today?” 

      This can be a dedicated broker or part of your platform tooling. The principle matters more than the brand. 

      qAPI’s advantage is that it can help you test for all traffic across your APIs (when integrated), so in many cases it can act as an implicit “contract registry”: 

      •  It knows what endpoints exist. 

      •  It knows which consumers call them and how. 

      •  It can detect drift between what’s documented and what’s happening. 

      Step 5: Build provider verification into the provider’s pipeline 

      For each provider try to add a step in CI pipeline that: 

      •  Finds all relevant contracts from the registry. 

      •  Stands up the provider (locally or in an ephemeral environment). 

      •  Replays contract requests and asserts responses match expectations. 

      If verification fails, the provider pipeline fails. 

      This is where friction appears in traditional setups: 

      •  Spinning services up is slow. 

      •  Data setup is tricky. 

      •  People get blocked by “false positives” (ambiguous expectations). 

      With qAPI: 

      •  You can often verify against a known staging environment where qAPI already runs tests. 

      •  qAPI’s agentic layer can help you classify failures: 

      This is a real contract break or data/environment issue or a change where contract and consumer both need an update. 

      Step 6: Define a contract evolution policy 

      Contracts will change. The question is whether you do it intentionally. 

      Let’s make it simple by adding rules like: 

      •  Non‑breaking changes: 

             •  Adding new optional fields and new endpoints with new versions is OK. 

             •  Breaking changes: 

      •  Removing fields, changing types, or altering semantics requires: 

                •  New API version, or Coordinated contract updates and consumer releases. 

      You also need a deprecation flow: 

      •  Mark contracts as deprecated in the registry. 

      •  Warn consumers when they rely on behavior that will soon be removed. 

      •  Enforce removal after a grace period. 

      Note:  Deprecation flow is a planned process that is widely used in software development to remove any old features, libraries or even APIs with a provision to maintain backward compatibility at all times. 

      Because qAPI continuously monitors usage, it can: 

      •  Tell you whether a field marked “deprecated” is still being used by any consumer. 

      •  Identify “dead” behavior that no one calls anymore but still exists. 

      Step 7: Extend contract testing to third‑party and AI APIs 

      If you’re using Stripe or OpenAI you can’t publish contracts, but you can: 

      •  Code your expectations for their APIs as contracts. 

      •  Periodically validate them against sandboxes or canary test calls. 

      •  Alert when behavior drifts (e.g., new fields, changed error formats). 

      For APIs: 

      •  You usually can’t assert exact text. But you can assert shape: 

               •  Top‑level keys exist (choices, usage, etc.). 

               •  Certain fields are always present and correctly typed. 

               •  Error payloads follow a known structure. 

      qAPI’s testing process is particularly useful here: 

      •  It can spot when a third‑party response shape has changed. 

      •  It can also detect if the endpoint’s behavior is now different from last week across your stack, not just in one test. 

      1. What “Strong” Contract Testing Looks Like in 2026

      A mature contract testing practice doesn’t mean “We have Pact in one repo.” 

      It looks more like: 

      1. Every critical integration has clearly defined contracts owned by both sides. 
      2. Consumer expectations are written as tests and run on every PR. 
      3. Providers verify against all known consumer contracts before deployment. 
      4. Contracts, specs, and actual traffic stay in sync—because an intelligent system is watching. 
      5. Third‑party and AI integrations have encoded expectations and drift detection. 
      6. Breaking changes are rare, planned, and communicated. 

      qAPI doesn’t replace contract tools outright—it orchestrates and amplifies them: 

      1. Uses traffic + specs to infer and update contracts. 
      2. Reduces manual maintenance by generating and adapting tests. 
      3. Watches for behavioral drift between provider, consumers, and docs. 
      4. Runs contract and functional tests as a unified, agentic layer in your pipelines. 

      7. If You Want to Start This Month

      If this all sounds great but large, here’s a realistic 30‑day plan that any lean team can implement: 

      Week 1 

      1. Pick 1–2 high‑risk integrations (e.g., payments ↔ orders ↔ ledger). 
      2. Document 3–5 key interactions each as contracts (even if only prose initially). 

      Week 2 

      1. Add consumer tests for these interactions in both directions (frontend/service side). 
      2. Run them locally and in consumer CI. 

      Week 3 

      1. Create a simple contract registry (could be Git + naming convention to start). 
      2. Add a provider‑side verification job for one service. 

      Week 4 

      •  Integrate qAPI or a similar intelligent platform, if available, to: 

                •  Observe real traffic and validate your contracts are realistic. 

                •  Highlight differences between what you think happens and what actually happens. 

                •  Start surfacing contract drift warnings in CI. 

      Once that first integration is stable and giving you signal, then scale to others. 

      Contract testing isn’t about worshipping specs; it’s about preventing your services from surprising each other. In a world where microservices, third‑party APIs, and AI‑generated code change fast, you need a way to encode expectations, verify them automatically, and spot changes early. 

      If your team is already investing in API testing with something like qAPI, contract testing is the natural next layer: it takes you from “our endpoints respond” to “our services evolve without breaking the people who rely on them.” 

      Executive Summary 

      Healthcare as a sector is actively accelerating their adoption of API-driven architectures to support interoperability, digital patient engagement, and data exchange across ecosystems. Standards such as HL7 and FHIR, combined with REST-based services, now are quite critical for clinical and operational workflows. 

      This shift has exposed structural gaps in testing, security, and governance. While many organizations continue to rely on fragmented or manual API validation processes. It has resulted in increased exposure to integration failures, security incidents, and regulatory non-compliance. 

      At the same time, external pressures—including rising ransomware activity, supply chain dependencies, and evolving data sovereignty regulations—are adding to the risk appetite and making it difficult for companies to survive. Because APIs have become a primary control point where these risks converge. 

      This case study explains how our customer a mid-sized healthcare provider implemented an AI-assisted, contract-aware API testing approach with qAPI to address these challenges. Read the complete story on how API testing with qAPI helped them evolve from a tactical activity into a strategic capability supporting resilience, compliance, and operational efficiency. 

      Recent industry data clearly shows why the urgency of addressing API led risks were completely valid: 

      At the same time, regulatory pressures around data sovereignty, localization, and cross-border data flows are increasing, adding further complexity to API governance and validation. 

       About Our Client 

      Our customer operates three acute‑care hospitals and multiple outpatient clinics with an enterprise EHR, ancillary systems, telehealth, and payer connectivity, supported by more than 150 internal and external APIs. Some systems are on‑premise; others are hosted on cloud platforms or managed by third‑party vendors, mirroring the increasingly hybrid, globally distributed infrastructure described in cloud‑migration studies.  

      They needed to transform how they handled their data and how they had set-up their API testing system. Their existing process relied heavily on manual testing and deep institutional knowledge to analyze customer data, scan reports, doctor’s thoughts, automated medicine schedule and etc. They needed to streamline, secure and scale their API systems to stay safe from external intrusion and maintain. The tech stack they were using:  

      They wanted to fix the following KPIs: 

      – Discover and catalog APIs across EHR, telehealth, and integration layers, including shadow and partner APIs. 

      – Automatically generate and maintain functional, regression, contract, and security tests for HL7/FHIR and REST endpoints. 

      – Embed resilience, negative, and geo‑aware tests into CI/CD to anticipate both technical failures and geopolitical disruptions. 

      – Reduce manual test creation and maintenance work, shorten deployment cycles, and lower the likelihood and severity of API‑related incidents, including ransomware and supply‑chain–driven outages. 

      We asked: Do you a massive framework to execute this task? 

      Answer: The right approach is to have a solution that fits right onto the specific use case 

       Solution: Implementing qAPI for Healthcare API Testing 

      In addition to its baseline capabilities, qAPI helped the healthcare provider to adapt to geopolitical and macro‑risk trends by: 

      Hardening against ransomware and nation‑state tactics: By continuously exercising authentication, authorization, and error‑handling paths for high‑value APIs, including those exposed to partners or the public internet, qAPI makes it harder for attackers to exploit misconfigurations or overlooked endpoints—attack vectors highlighted in recent healthcare cybersecurity research. 

      Testing for cloud and supply‑chain resilience: qAPI can run scenario tests against failover endpoints, alternate regions, or vendor sandbox environments to validate that APIs degrade gracefully or reroute traffic when third‑party services become unavailable, an approach recommended in analyses of supply‑chain‑driven outages. 

      Supporting dataresidency and sovereignty strategies: By tagging tests and endpoints with region and dataclassification metadata, qAPI enabled our customer to verify that calls in each jurisdiction to use the correct regional endpoints and do not leak PHI across borders, aligning with emerging datalocalization and geopatriation practices. 

      Impact: Resilience, Compliance, and Operational Efficiency 

      With qAPI added in their tech stack the AI-assisted, contract-aware API testing approach has delivered measurable improvements across Our customer’s health engineering, security, and compliance functions. In addition to previously observed gains in release velocity and reduced manual effort, the organization has achieved significant progress in resilience and risk mitigation. 

      From an operational standpoint, automated testing has reduced manual testing effort by approximately 50–60%, allowing engineering teams to reallocate time toward higher-value development work.  

      Release cycles have accelerated by an estimated 30–40%, driven by continuous validation of APIs within CI/CD pipelines and faster identification of integration issues. 

      In terms of system resilience, contract-driven testing and automated regression coverage have contributed to a 35–50% reduction in API-related defects reaching production.  

      By validating changes against predefined contracts, our customer has managed to minimize the risk of breaking changes caused by rapid configuration updates, emergency patches, or third-party dependencies.  

      Additionally, the integration of end-to-end testing has improved vulnerability detection rates by up to 40%, reducing exposure to ransomware and other advanced threats. 

      The solution has also strengthened compliance and audit readiness.  

      Region-aware test suites have enabled consistent validation of data flows across jurisdictions, helping ensure that the company is adhering to evolving data localization and sovereignty requirements.  

      As a result, audit preparation time has decreased by approximately 25–35%, with automated test documentation providing clear, verifiable evidence for regulators, partners, and payers. 

      These combined improvements have shifted API testing from a reactive process to a proactive control layer. By reducing production incidents, accelerating delivery, and strengthening compliance posture, our customer has effectively transformed testing into a strategic capability—one that protects revenue, enhances system reliability, and supports operations in an increasingly complex global environment. 

      About us 

      qAPI, part of Qyrus, is a leading codeless API testing platform that specializes in delivering advanced cloud based testing solutions. We help businesses with innovative tools and services designed to streamline API testing, ensure reliability, and enhance application performance. Trusted by financial institutions, logistics companies, and many more worldwide, we help organizations create products and APIs they can depend on for seamless performance and integration. To learn more about our products and services, visit us at qyrus.com/qapi