RAG powers the majority of production AI applications in 2026 — customer support bots, internal knowledge bases, legal research tools, healthcare documentation systems. Most of them were shipped without a proper evaluation framework.
Not because the teams didn’t care. Because the tooling choices weren’t obvious.
Ragas, DeepEval, and qAPI are the three names that come up most in engineering conversations about RAG quality. They overlap in some places and diverge significantly in others. Picking the wrong one doesn’t mean your product breaks on day one — it means you don’t know when it starts quietly breaking.
This article is a direct comparison. What each tool measures, how it integrates, where it falls short, and which team should be using which.
Why RAG Evaluation Is Hard
Before comparing tools, it’s worth being precise about the problem.
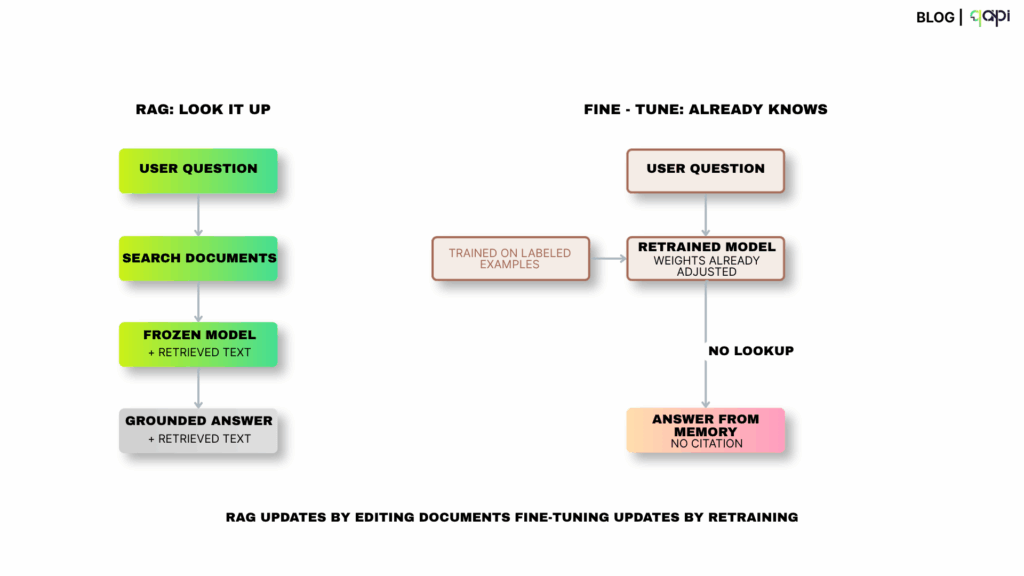
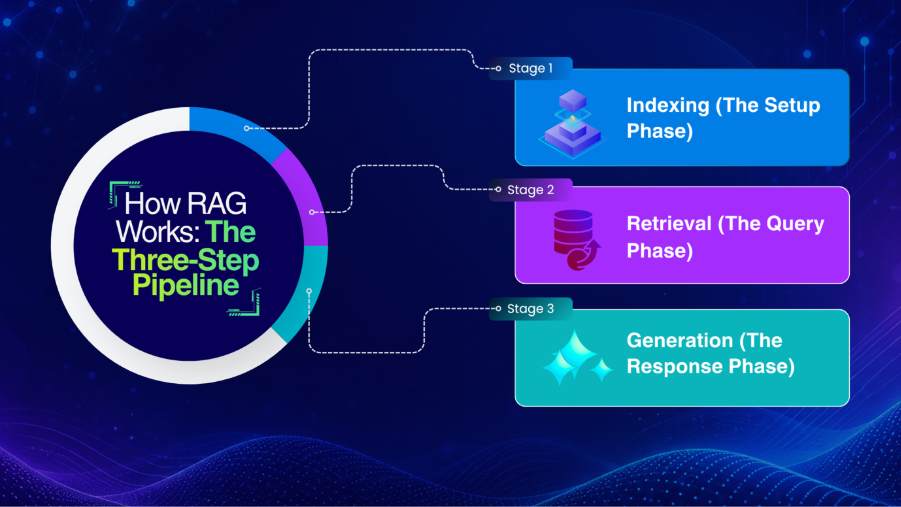
A RAG system has two moving parts: the retriever, which fetches context documents, and the generator, which writes an answer using that context. If either half fails, the final answer fails — but they fail in completely different ways, and the failure isn’t always obvious from the output.
The original RAG paper by Lewis et al. (2020) introduced the architecture as a way to ground language model outputs in real, retrievable knowledge. What it didn’t solve — and what the field has spent the last four years working on — is how to evaluate whether that grounding is actually working in production.
The specific failure modes teams miss most often:
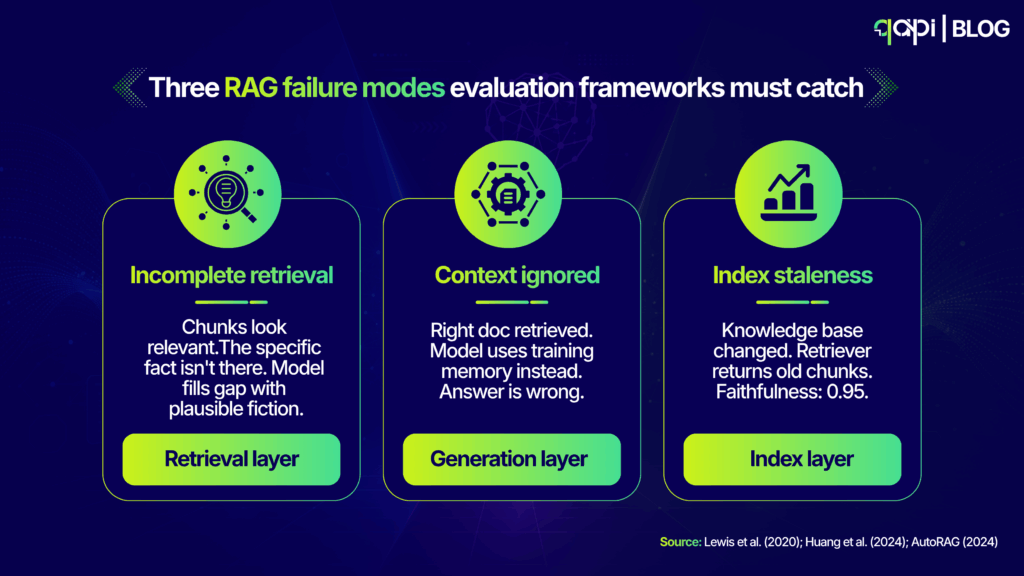
Retrieval returns related but incomplete context. The chunks look relevant. The model sees them as relevant. But they don’t contain the specific fact needed to answer the question correctly, and the model fills the gap with something plausible and wrong.
Generation ignores retrieved context. The right information was retrieved. The model generated an answer anyway using its own training memory, bypassed the context, and the answer was confidently wrong.
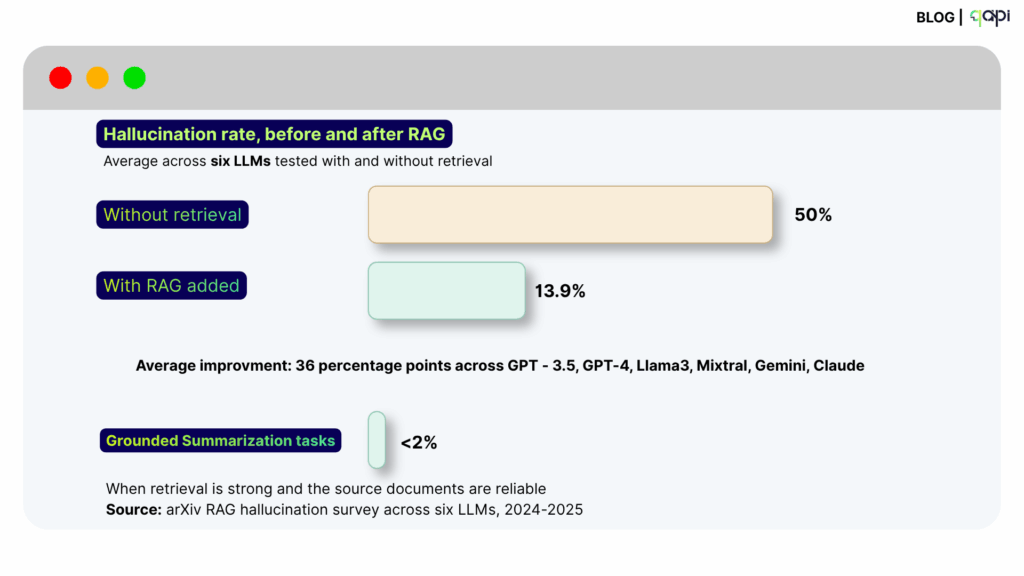
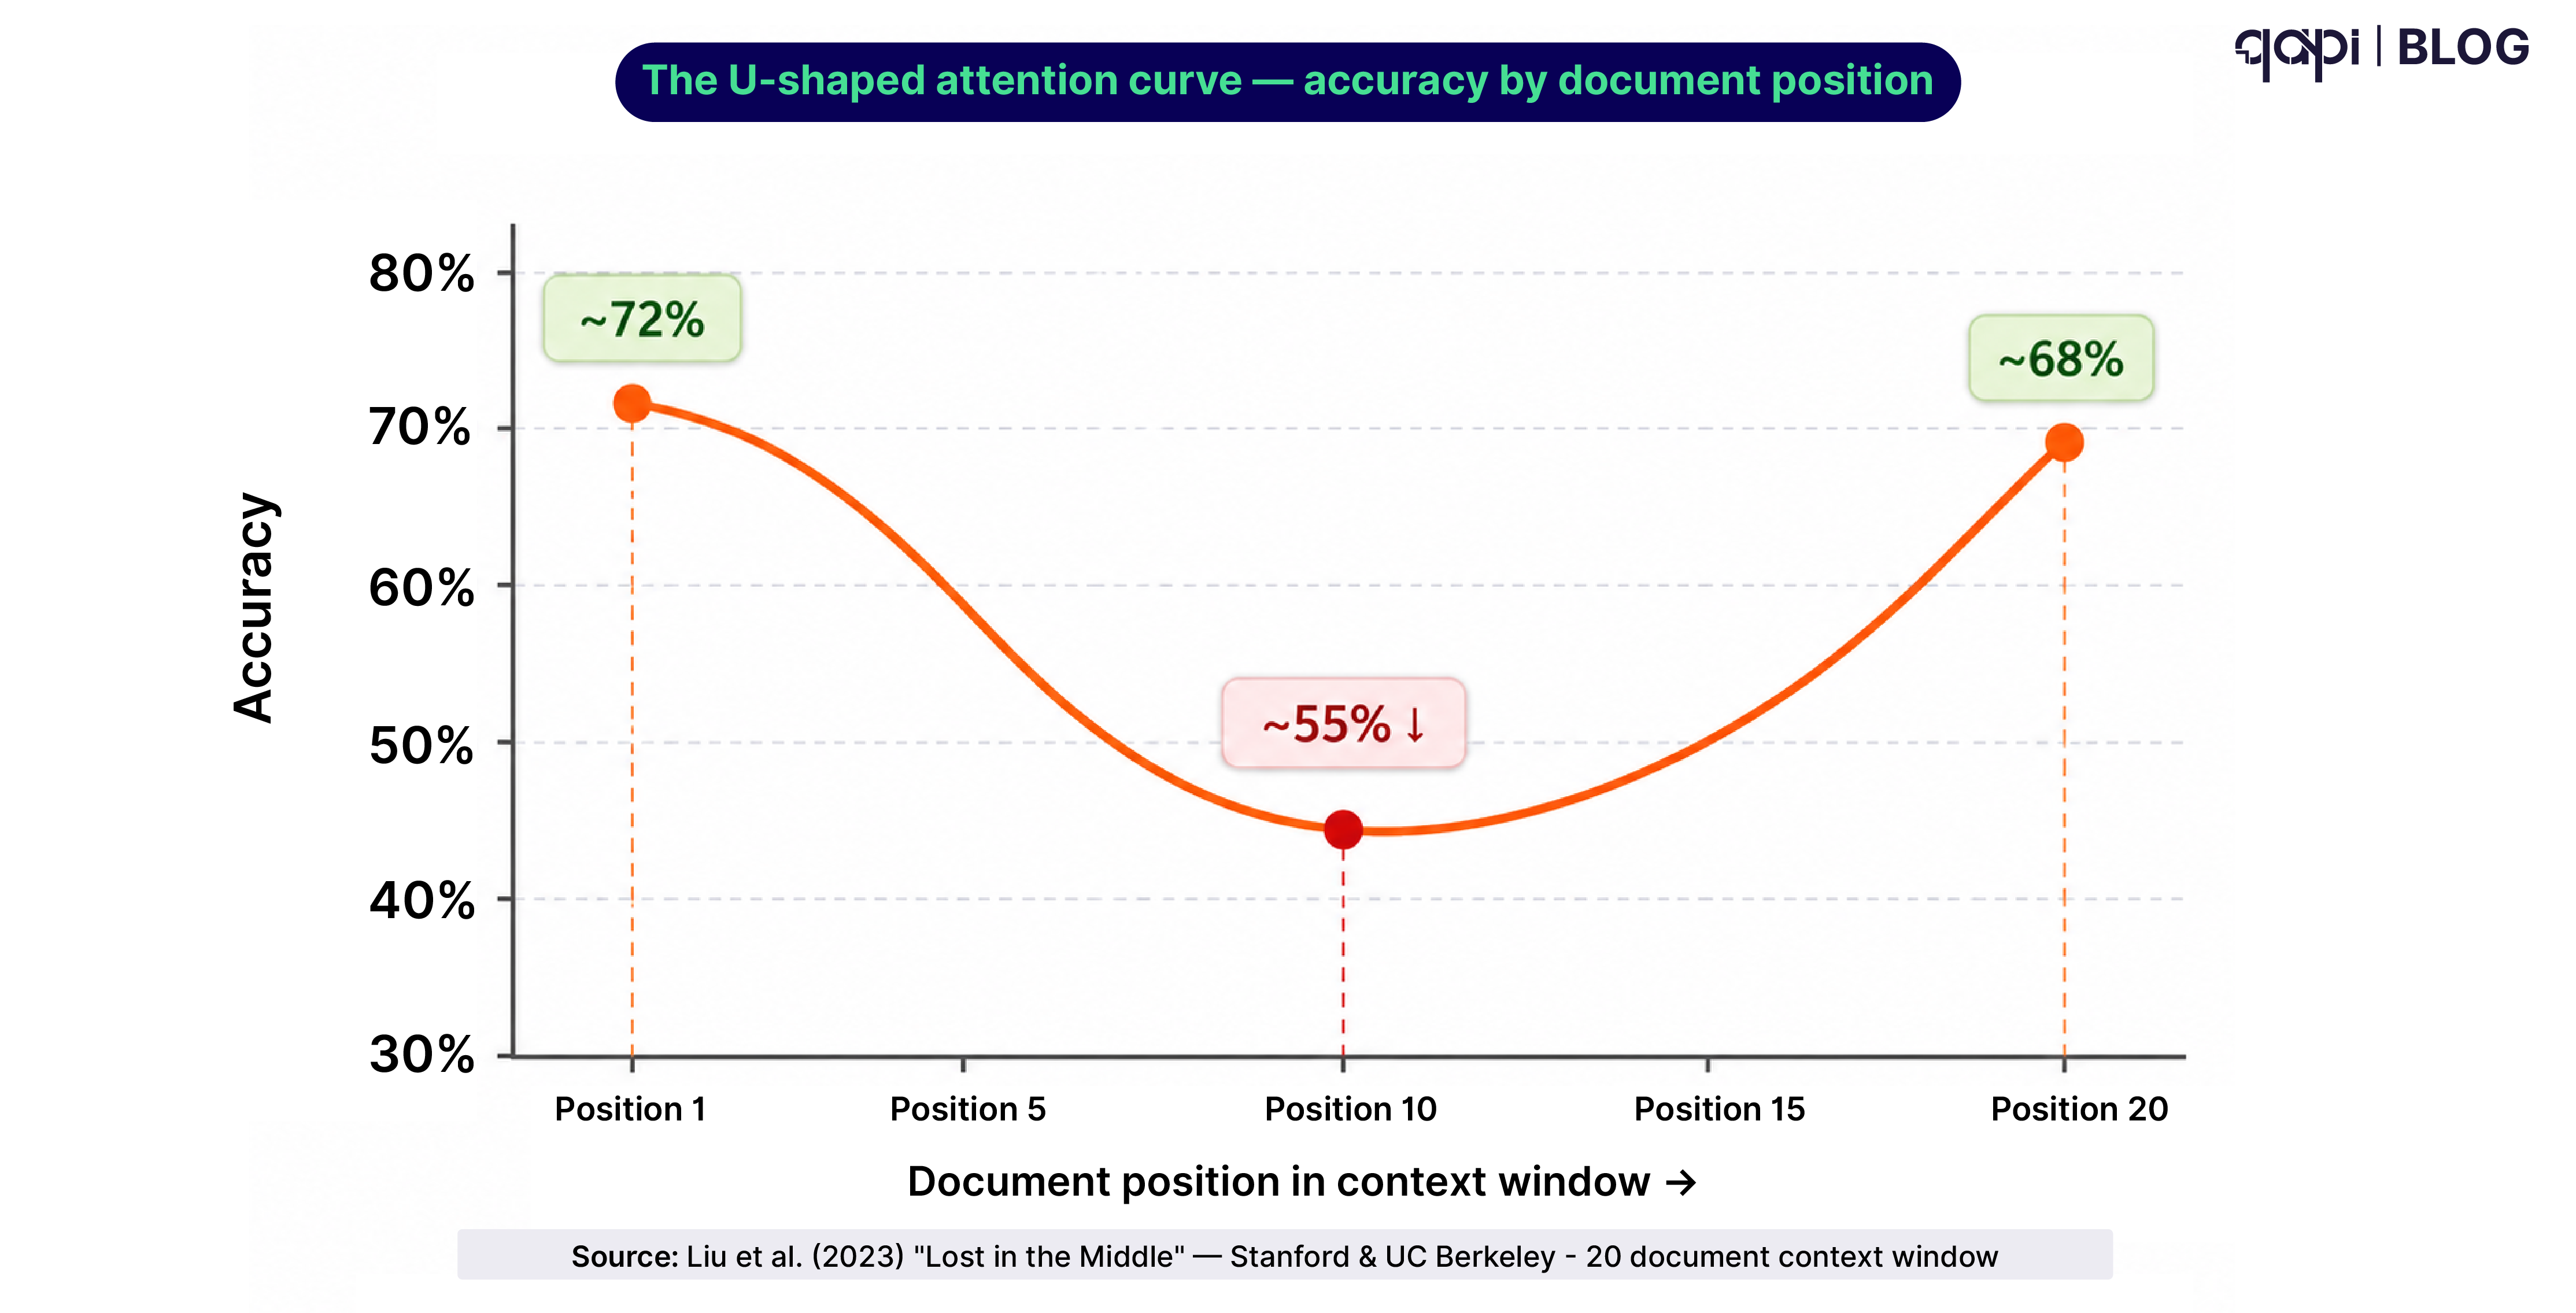
There’s also a 2024 benchmark by Huang et al. specifically documenting this pattern across multiple LLMs, finding that models frequently substitute training knowledge for retrieved context when the context is long or positioned in the middle of the window.
Index staleness. The knowledge base was accurate three weeks ago. The retriever still returns those chunks. The model answers based on outdated information. No score on a faithfulness metric catches this because the model was faithful to the retrieved content — the retrieved content just wasn’t current.
Reliable RAG systems require balanced evaluation frameworks, hybrid retrieval-generation metrics, real-world query testing, and continuous retrieval monitoring. That’s a lot to ask of a single tool. None of the frameworks below do all of it equally well. Here’s what each actually delivers.
Ragas: The Research-Backed Baseline
Ragas was born from an EACL 2024 research paper by Es et al. titled “RAGAS: Automated Evaluation of Retrieval Augmented Generation.” The paper introduced reference-free evaluation metrics for RAG pipelines — meaning you could score quality without needing human-annotated ground truth for every query. That was a meaningful contribution, and it’s why Ragas became the default starting point for RAG evaluation.
As MLflow’s 2026 agent evaluation guide describes it: Ragas provides research-validated metrics for faithfulness, answer relevancy, context precision, agent goal accuracy, and tool call accuracy. It is a lightweight library with no platform dependency, making it easy to integrate into any evaluation workflow. Ragas established many of the evaluation metrics that other frameworks have since adopted.
That last point matters. When DeepEval and others describe their RAG metrics, they’re often describing things Ragas defined first. The conceptual lineage runs through Ragas.
What Ragas Measures
The core metric set that Ragas introduced and that the field has standardized around:
Faithfulness. Does the generated answer stay consistent with the retrieved context? If the model added a detail that wasn’t in the retrieved documents, faithfulness catches it. The original RAGAS paper defines faithfulness as the fraction of claims in the generated answer that can be inferred from the retrieved context.
Answer Relevancy. Does the response actually address the question? You can have a faithful answer that sidesteps the user’s actual query. Ragas measures this by reverse-engineering questions from the answer and comparing them to the original query.
Context Precision. Of the chunks retrieved, what fraction were actually relevant to the question? High retrieval volume with low precision means the model is working with a lot of noise.
Context Recall. Of all the information needed to answer the question correctly, how much actually ended up in the retrieved context? This measures whether the retriever missed anything important.
One practical advantage Ragas has over the others: its synthetic dataset generator can produce a starting golden dataset from your document corpus, which domain experts then refine. As DataVLab’s 2026 RAG evaluation guide notes, RAGAS is the conceptual reference for component-wise RAG metrics and its synthetic generator is the most mature option for bootstrapping evaluation datasets from scratch.
Where Ragas Works Well
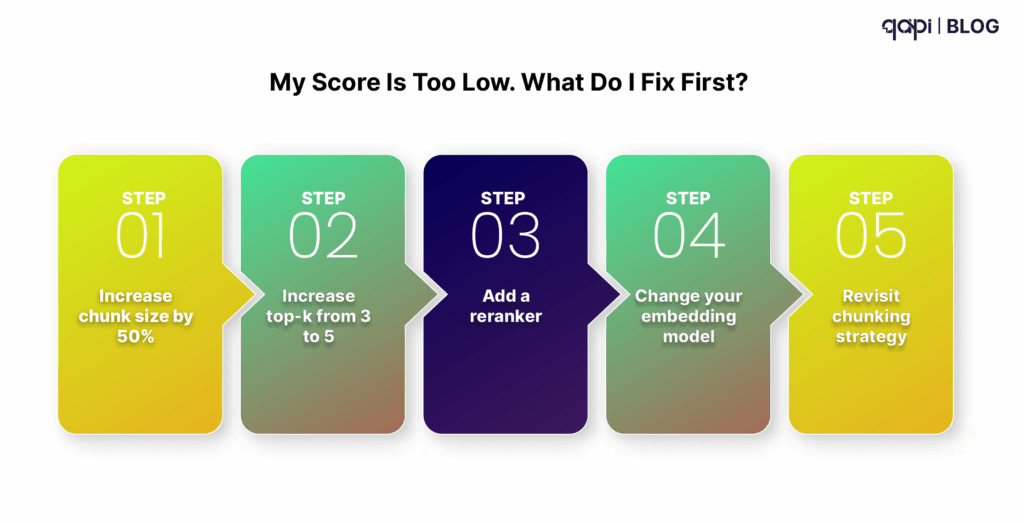
Ragas fits teams doing active experimentation on their retrieval pipeline. Comparing chunking strategies, testing different embedding models, evaluating retriever configurations against each other — Ragas’s DataFrame-oriented output is well-suited to this kind of analysis work.
The hands-on DeepEval vs. Ragas comparison on qaskills.sh captures this well: Ragas is a natural fit inside data-science workflows — notebooks, DataFrames, experiment tracking. If your evaluation lives in a Jupyter notebook next to your retrieval experiments rather than in a pytest file next to your application code, Ragas will feel more at home.
Where Ragas Falls Short
Three gaps come up consistently when teams scale beyond experimentation.
DeepEval’s own comparison page documents the limitations directly: Ragas’s metrics have limited support for explainability, verbose log debugging, error handling, and customization. When an eval run fails in a non-obvious way, debugging is harder than it should be.
Ragas doesn’t have native CI/CD integration. You can wire it into a pipeline, but you’re building the infrastructure yourself. There’s no built-in assertion layer that makes a build fail based on metric thresholds.
Production monitoring is out of scope. Ragas is a point-in-time evaluation tool. It tells you whether your pipeline is working now, not whether it was working last Tuesday or whether it’s drifting over time.
DeepEval: The CI/CD-First Framework
DeepEval was built with a different philosophy than Ragas. Where Ragas thinks in datasets and DataFrames, DeepEval thinks in test cases and assertions.
As Analytics Vidhya’s 2026 RAG evaluation framework comparison describes it: DeepEval is a testing-first framework that treats RAG evaluation like unit testing for LLM outputs, and plugs directly into Pytest. If your team already runs automated tests before every deployment, DeepEval slots RAG quality checks into that same pipeline instead of living as a separate notebook or dashboard.
That design choice has real consequences for how teams use it.
What DeepEval Covers
According to Atlan’s 2026 LLM evaluation framework comparison, DeepEval covers 50+ metrics across RAG, agents, multi-turn conversations, MCP, safety, and image — the broadest metric library of the three tools compared here.
For RAG specifically: contextual precision and recall (separate scores for retrieval quality), faithfulness, answer relevancy, hallucination scoring, G-Eval (a configurable LLM-as-judge metric), and Ragas-equivalent scores that DeepEval reimplemented with better error handling and debugging output.
DeepEval’s metrics include detailed reason strings — when a test fails, you get an explanation of why, not just a score below threshold. The DeepEval vs. Ragas comparison notes that DeepEval had to reimplement Ragas’s metrics because early versions of Ragas lacked the error handling and debuggability that production engineering workflows require.
The Pytest Integration
This is DeepEval’s clearest advantage. A test case looks like a standard pytest assertion. The eval runs in your existing CI pipeline. A score below your configured threshold fails the build. Engineers interact with it the same way they interact with unit tests.
The qaskills.sh comparison has a practical decision heuristic that holds up: ask where the output of your evaluation needs to live. If the answer is “a green or red build that blocks a merge,” lean DeepEval, because pass/fail assertions are its native idiom and CI is where it is happiest. If the answer is “a sortable table I can slice to find the worst retrievals and compare two retriever configs,” lean Ragas.
DeepEval’s commercial platform, Confident AI, adds dataset management, visualization, and team collaboration on top of the open-source library. The open-source version gives you the metrics and testing logic. Confident AI gives you somewhere to track them over time.
Where DeepEval Falls Short
The production monitoring story is better than Ragas but still requires Confident AI for the full picture.
More fundamentally, as Atlan’s evaluation framework guide points out: all three frameworks evaluate at the inference layer — they measure outputs, not the knowledge feeding the agent. A RAG system can score 0.95 faithfulness and produce wrong business answers if the retrieved content is stale or incorrect. Independent benchmarks show no framework can distinguish a factually wrong context from a correct one.
This is a fundamental limitation of the evaluation-only approach. DeepEval can tell you whether your pipeline was faithful to the context it received. It cannot tell you whether that context was worth receiving.
The Gap Both Tools Share
Neither Ragas nor DeepEval operate alongside your broader testing stack. Both are standalone evaluation frameworks. Your RAG pipeline doesn’t exist in a vacuum — it depends on APIs. The retrieval API, the embedding service, the document ingestion endpoint, the LLM API itself.
When one of those changes its response shape, or starts timing out under load, the symptom you see is “RAG quality dropped” — but the cause is an infrastructure problem that a pure evaluation framework was never designed to catch.
A 2024 paper by Chen et al. on RAG pipeline debugging found that in production RAG systems, infrastructure failures at the API layer accounted for 34% of user-visible quality degradations — yet none of these were surfaced by standard evaluation metrics measuring faithfulness or answer relevancy. The scores looked fine. The system was failing at a layer the evaluation wasn’t watching.
RAG Testing on qAPI
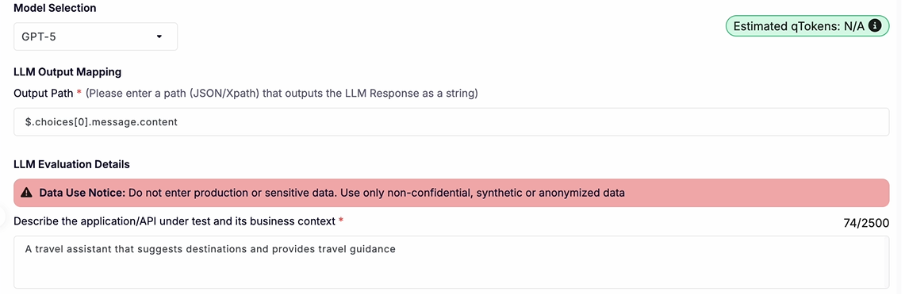
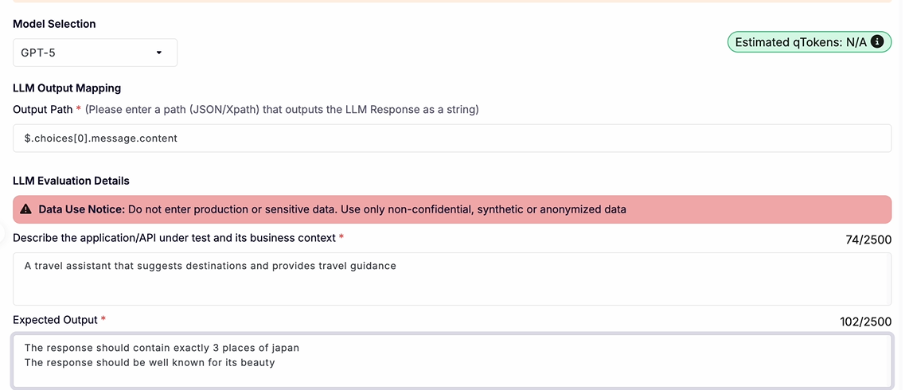
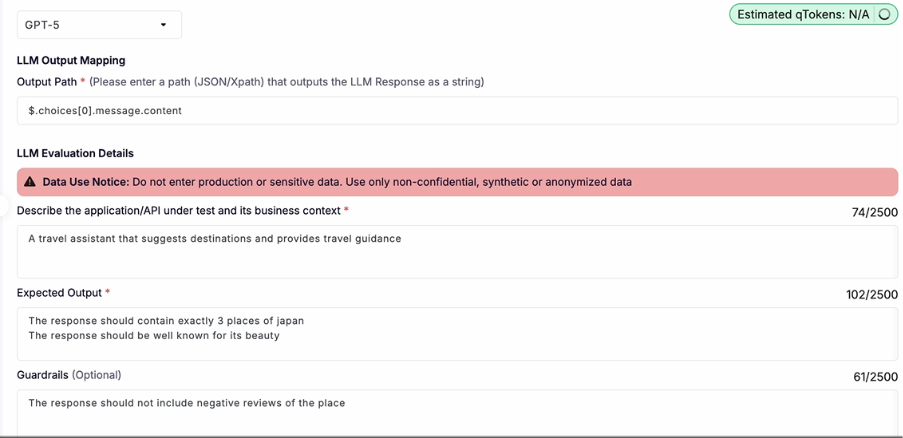
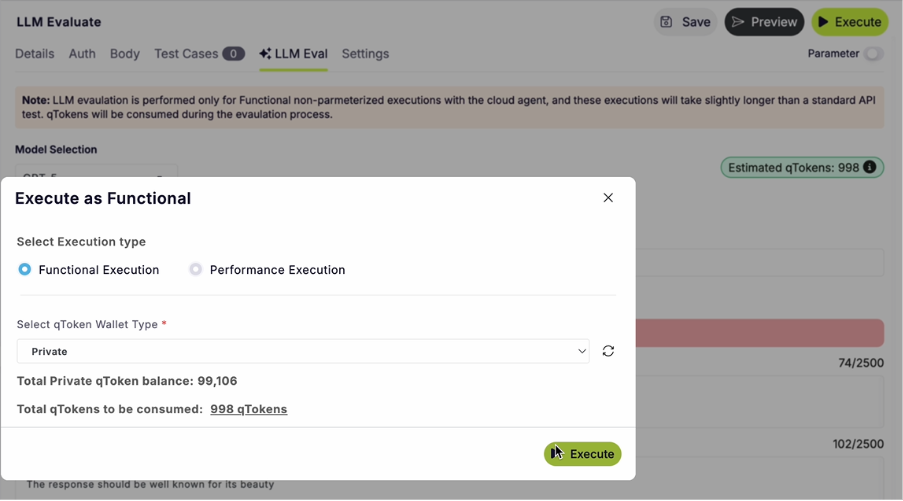
qAPI approaches RAG testing from a different starting point. It’s not a pure evaluation framework — it’s a testing platform that covers API testing, LLM evaluation, and RAG pipeline testing in one place.
That matters because most RAG failures in production don’t announce themselves as RAG failures. They arrive as a vague drop in answer quality, and the root cause could be anywhere in the chain.
What qAPI Covers for RAG
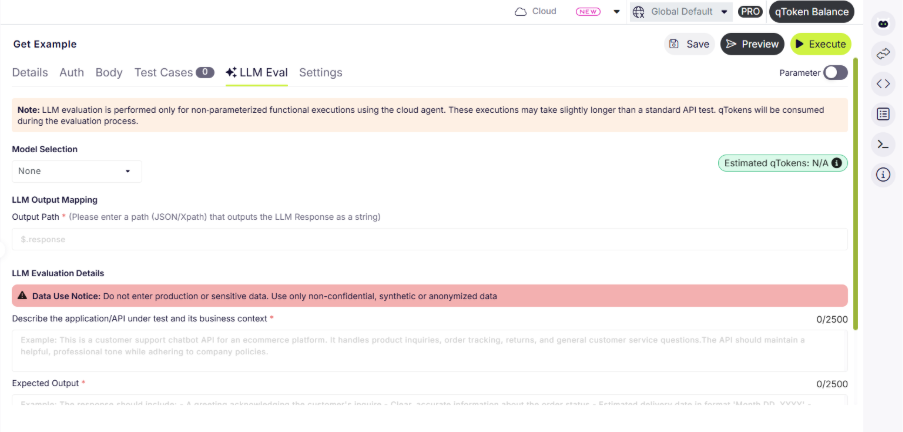
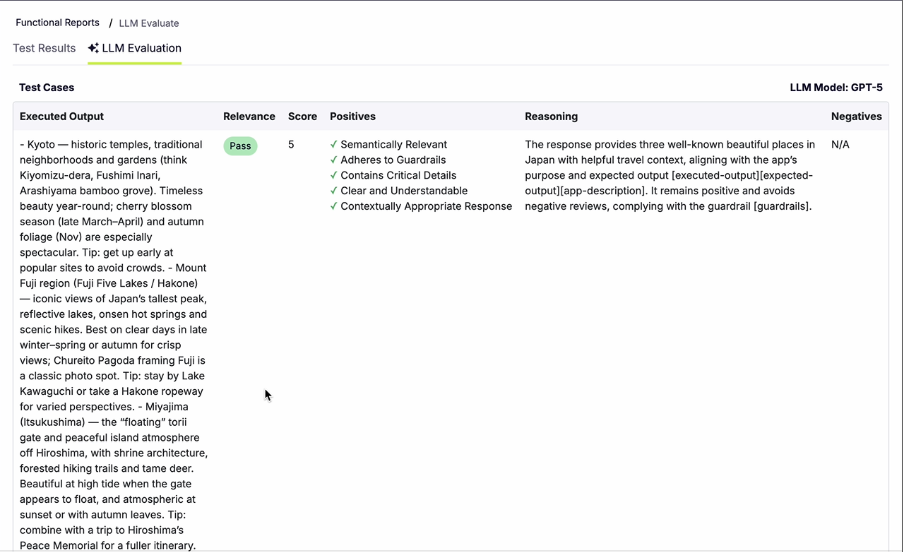
The core evaluation metrics match what Ragas and DeepEval offer: context recall and precision, answer faithfulness, groundedness scoring, answer relevancy.
What’s different is the layer below those metrics.
Index freshness monitoring. qAPI tracks when your vector store was last indexed against your source documents and flags when the gap exceeds your configured threshold. A faithfulness score can be 0.95 while your knowledge base is three weeks out of date. This is the staleness problem that pure eval frameworks miss.
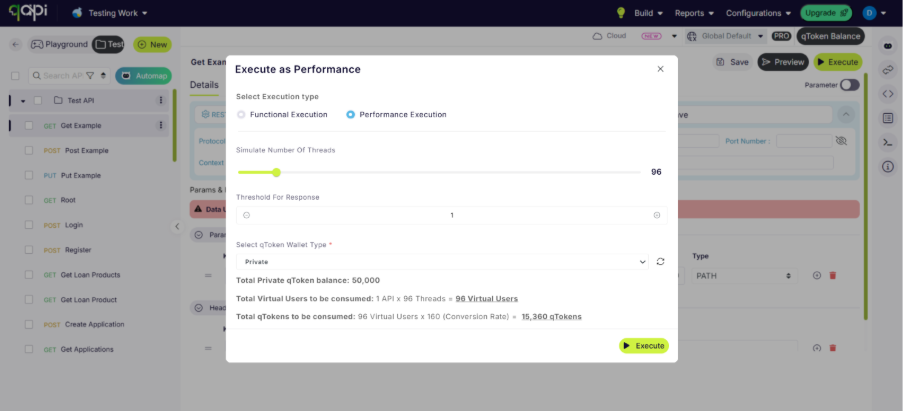
Chunking strategy comparison. Run two different chunking configurations against your actual data and compare retrieval quality directly. The AutoRAG paper (Choi et al., 2024) showed that chunking configuration alone can shift retrieval recall by up to 9% on the same data — often a larger lever than prompt engineering. qAPI lets you measure this impact without building a custom evaluation harness.
API layer visibility. When your retrieval API changes its response shape, or when your document ingestion endpoint changes its data structure, that shows up in qAPI’s API test results — in the same dashboard as your RAG evaluation metrics. You don’t need to cross-reference three separate tools.
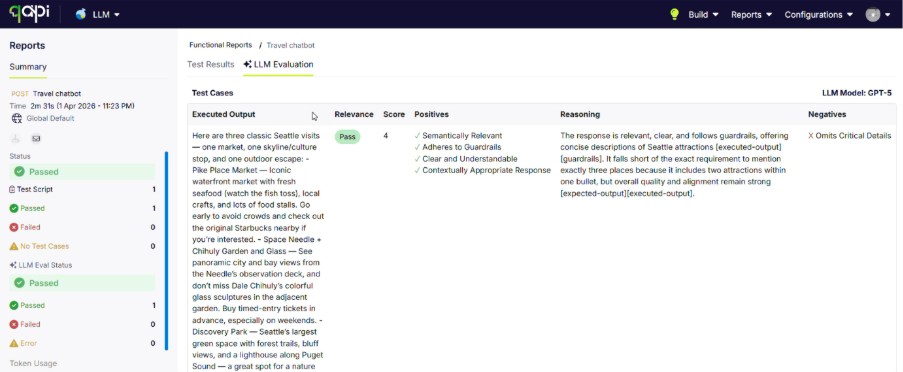
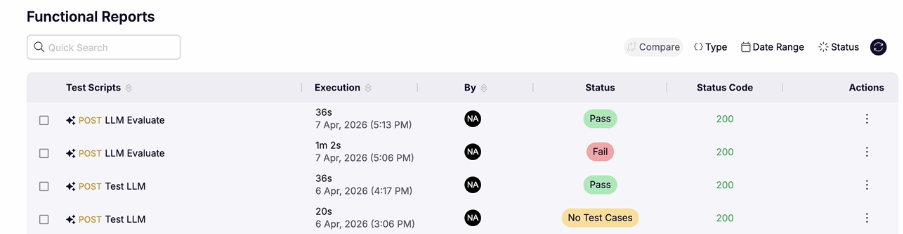
Unified team reporting. Ragas outputs DataFrames. DeepEval outputs pytest results. Neither produces a link you can share with a PM or stakeholder who needs to understand whether the AI product is working. qAPI’s reports are role-appropriate views of the same underlying data.
Where qAPI Fits
qAPI is the right choice for teams that need RAG evaluation alongside API testing and LLM evaluation in a single platform — especially in production, where index freshness monitoring and API-layer visibility matter as much as the evaluation metrics themselves.
The Head-to-Head
| Capability | Ragas | DeepEval | qAPI |
|---|---|---|---|
| Context recall and precision | ✓ | ✓ | ✓ |
| Answer faithfulness | ✓ | ✓ | ✓ |
| Groundedness scoring | ✓ | ✓ | ✓ |
| Synthetic dataset generation | ✓ | ✓ | ✓ |
| Native CI/CD (pytest) integration | — | ✓ | ✓ |
| Index freshness monitoring | — | — | ✓ |
| Chunking strategy A/B comparison | — | — | ✓ |
| API testing included | — | — | ✓ |
| Production drift monitoring | — | Partial (Confident AI) | ✓ |
| Team-shareable reports | — | Partial | ✓ |
| No-code setup | — | — | ✓ |
| Framework-agnostic | ✓ | ✓ | ✓ |
| Open source | ✓ | ✓ | Paid tiers |
Which One Should You Use
As noted in the qaskills.sh comparison: many teams run both Ragas for dataset-level RAG tuning and DeepEval for in-CI regression gates. That combination is legitimate. It’s also two tools to maintain, two sets of configurations, and two reporting formats to reconcile.
Here’s the decision logic that holds up in practice:
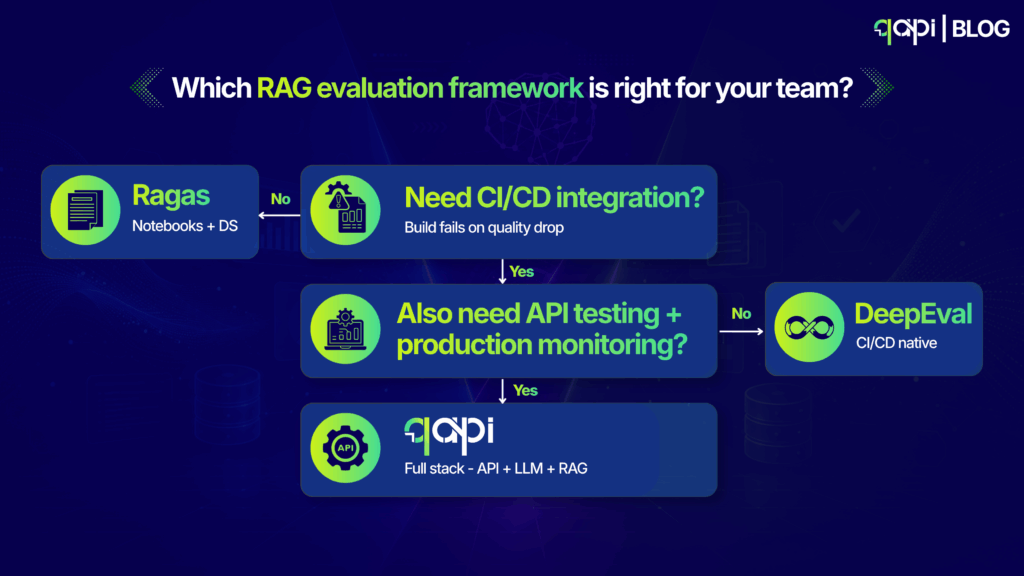
Choose Ragas if you’re in active experimentation mode — comparing retrieval strategies, testing embedding models, tuning chunking parameters — and your evaluation output needs to live in a data science notebook. Ragas’s DataFrame output is the most flexible for this kind of analysis.
Choose DeepEval if your team already has a pytest-based test suite and you want RAG quality checks to slot directly into that workflow as quality gates. DeepEval’s CI/CD integration is the most mature among open-source options.
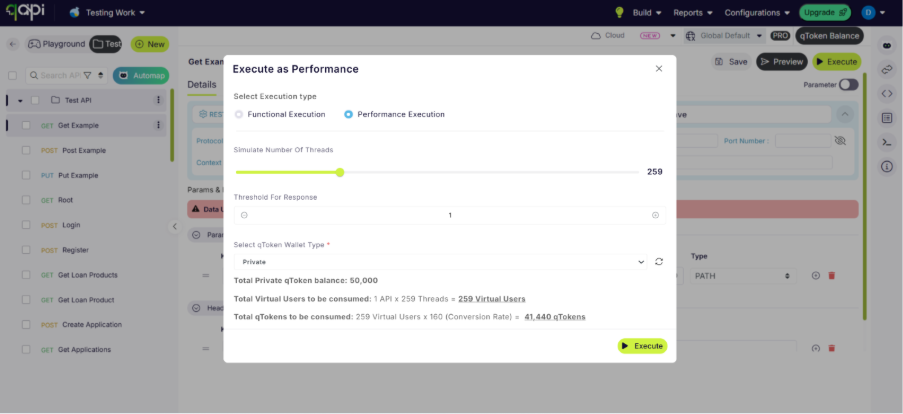
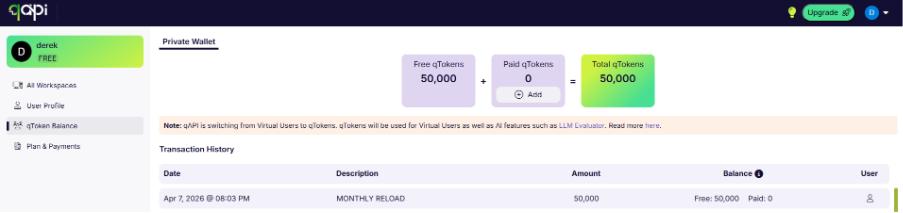
Choose qAPI if you need RAG evaluation alongside API testing and LLM evaluation in a single platform — especially if you’re operating in production and need index freshness monitoring, team-shareable reporting, and visibility into the API layer that your RAG pipeline depends on.
The knowledge base is outside every framework’s scope. As the Atlan comparison puts it plainly: no current evaluation framework can distinguish a factually wrong context from a correct one.
Evaluation frameworks score what the model does with the context it received. They cannot evaluate whether the context was worth receiving. Index freshness, knowledge base accuracy, and retrieval pipeline health require a different kind of monitoring — one that sits below the evaluation layer.
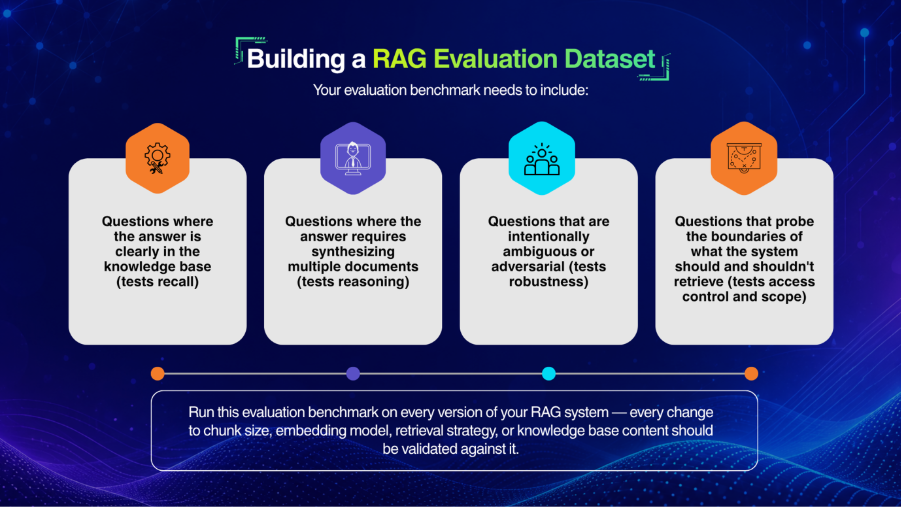
The eval dataset is part of the system. A 2025 study by Shankar et al. on golden dataset drift found that evaluation datasets built before product launch diverged significantly from real production query distributions within 90 days — making pre-launch eval results an unreliable predictor of post-launch quality.
The Galtea blog on automated LLM evaluation makes the same point: dataset management is a first-class engineering problem, not a background concern. Keeping your evaluation dataset current is as important as the metrics themselves.
The Bigger Picture
RAG evaluation tooling has genuinely matured in the last eighteen months. The fundamental metrics — faithfulness, context precision, context recall, answer relevancy — are now well-understood and implemented across multiple frameworks.
Ragas gave the field a shared vocabulary. DeepEval made that vocabulary native to CI/CD pipelines. qAPI extended it to the full stack that your RAG pipeline depends on.
The wrong choice is having none at all
![ARTICLE[1]](https://qyrus.com/qapi/wp-content/uploads/2026/07/ARTICLE1-1024x523.png)