A prompt change ships on Thursday. The engineer tested it on five examples and it looked better. Two Mondays later, there are 60 support tickets about an answer pattern — the exact category the prompt change was supposed to fix, but now failing on a different edge case nobody tested.
This is the problem automated LLM evaluation is built to solve. As the Galtea engineering blog on CI/CD quality gates defines it: automated LLM evaluation is a CI/CD pipeline where every change to a prompt, model version, or retrieval configuration triggers an eval run against a versioned golden dataset.
Most software teams already know how to do this for code. Commit, test, gate, deploy. The same logic applies to LLM applications. It’s just harder to implement because LLM outputs are probabilistic, not deterministic — and most teams haven’t set up the infrastructure yet.
This is a practical guide to building that pipeline. Step by step, with the specific design decisions that determine whether it actually works in production.
Why “Vibe Checks” Don’t Scale
The dominant evaluation method for LLM applications in production is still eyeballing outputs. Someone on the team reads through a sample of responses and decides whether quality is acceptable.
A 2024 Stack Overflow developer survey found that 76% of developers using LLMs in production relied primarily on manual review to assess output quality. The same survey found that only 23% had implemented any form of automated quality monitoring for their AI features. These are production systems serving real users, evaluated by gut feel.
This works when your query volume is low enough to read manually, your team has time to check before every deployment, and quality is either clearly good or clearly broken — not subtly degrading. None of those conditions hold at production scale.
Braintrust’s 2026 guide to AI evaluation in CI/CD makes the case directly: the best LLM applications aren’t built through endless manual testing sessions. They’re built through systematic, automated evaluation that runs with every code change. Teams are moving beyond one-off evaluations to continuous validation that runs automatically with every deployment.
The shift requires three things: a dataset that represents what real quality looks like, metrics that measure it automatically, and a pipeline that runs both on every change. Here’s how to build each one.
Step 1: Define What You’re Testing
Before writing any pipeline code, you need to answer one question: what does “good” mean for your specific LLM application?
For a RAG-based customer support bot, “good” probably includes:
• Answers that accurately reflect the company’s documented policies (faithfulness)
• Responses that address what the customer actually asked (relevancy)
• Answers that don’t add details the documentation doesn’t support (groundedness)
• Responses that are consistent in tone and format (consistency)
For an internal document summarization tool, the metrics shift. Faithfulness and groundedness still matter, but exact citation accuracy might matter more than answer relevancy. For a coding assistant, you care about syntax correctness, whether generated code compiles, and whether it follows your existing patterns.
The mistake most teams make: applying a generic evaluation template before deciding what matters for their specific case.
The ContextQA 2026 guide to LLM testing tools is specific about calibration: measure judge agreement against 20 to 30 human-labeled examples specific to your task before using it as a CI gate. A judge achieving less than 80% agreement with human evaluators on your specific task type is not reliable enough for automated quality gates.
This step takes longer than it should. Budget a full sprint for it. The clarity you get from defining “good” in measurable terms before writing any pipeline code pays back across every subsequent evaluation run.
Step 2: Build Your Golden Dataset From Real Queries
The golden dataset is the most important piece of your evaluation pipeline and the most commonly done wrong.
A golden dataset is a curated set of inputs (queries), expected outputs or reference answers, and — for RAG systems — the relevant source documents. Every automated evaluation run measures your system’s outputs against this dataset.
The problem: most teams build golden datasets from hypothetical questions written before launch. The engineering team gathers in a room, writes down the questions they think users will ask, and calls it done.
A 2025 paper by Shankar et al. on LLM evaluation validity found that evaluation datasets built before product launch diverged significantly from real production query distributions within 90 days. The queries users actually ask look nothing like the questions developers anticipate. That divergence means your pre-launch eval set will pass on queries it was designed to catch while missing the ones that actually cause problems.
Building the Dataset in Practice
Start with real production traffic, even if you’re pre-launch. If you have a staging environment or beta users, instrument it to log queries. Even 100 real queries is more valuable than 500 hypothetical ones.
If you’re truly pre-launch, use a synthetic generator as a starting point. The RAGAS framework includes a synthetic dataset generator that creates question-answer pairs from your document corpus. Treat the generated dataset as a scaffold that domain experts then review and refine.
Seed with known failure modes. When an edge case breaks production, add it to the golden dataset immediately. The dataset should grow to include every failure mode you’ve discovered.
Version it like code. The Galtea evaluation guide is direct on this point: the golden dataset drifts over time as product scope changes, as failure modes are discovered, and as the team adds coverage for new query types. Dataset management is a first-class engineering problem. Treat dataset versions the same way you treat code versions — with a changelog, a review process, and clear ownership.
For most teams starting out, 50 to 100 high-quality, diverse examples is enough to get meaningful signal. You don’t need 10,000 examples to start.
Step 3: Choose Your Evaluation Metrics
With a golden dataset in hand, you need to decide what to measure.
For RAG Applications
Faithfulness. Does the generated answer reflect what was in the retrieved context? The original RAGAS paper (Es et al., 2024) defines faithfulness as the fraction of claims in the answer that can be inferred from the retrieved context. This is the primary metric for catching hallucinations in grounded generation.
Context recall. Of all the information needed to correctly answer the question, how much appeared in the retrieved chunks? This is a retriever-level metric, not a generator-level one. Low recall means the retriever is missing relevant content before the model ever sees the query.
Context precision. Of the chunks that were retrieved, what fraction were actually relevant? Low precision means the model is working with noise, which increases hallucination risk even when the right content is somewhere in the context.
Answer relevancy. Does the response address the actual question? High faithfulness plus low relevancy means the model answered a different question accurately.
Groundedness. A stricter version of faithfulness — every claim in the answer must be traceable to a specific retrieved passage. This is the right metric for high-stakes domains like healthcare or legal, where the standard for evidence is higher.
For LLM Applications Without RAG
G-Eval / LLM-as-judge. Use a separate language model to score outputs on custom criteria. A 2023 paper by Liu et al. validated this approach, showing that LLM-based evaluators correlate well with human judgments on open-ended generation tasks — significantly better than string-match or n-gram metrics.
Task-specific deterministic metrics. For coding assistants: does the output compile and pass unit tests? For summarization: do named entities and key facts appear? These are your most reliable signals because they’re deterministic, not probabilistic.
A Note on LLM-as-Judge Reliability
LLM-as-judge is flexible but has a known failure mode. As the Galtea evaluation guide explains: an LLM judge that scores faithfulness is itself a model — it can produce false negatives. An eval run that produces a 0.82 faithfulness score is an estimate with error bars, not a deterministic pass/fail.
A 2024 meta-evaluation study by Zhu et al. found that LLM judges show systematic biases toward longer, more verbose responses, responses that match their own training style, and responses that appear authoritative regardless of accuracy. Calibrate your judge against human labels before trusting it as a deployment gate.
Step 4: Set Quality Thresholds
A threshold is the minimum acceptable score below which a build fails. Setting them is uncomfortable because it forces you to be specific about what “acceptable” means.
Start realistic, not aspirational. If your current faithfulness score is 0.84, set the gate at 0.78. This catches meaningful drops while allowing normal variance. Raise the threshold as your system improves.
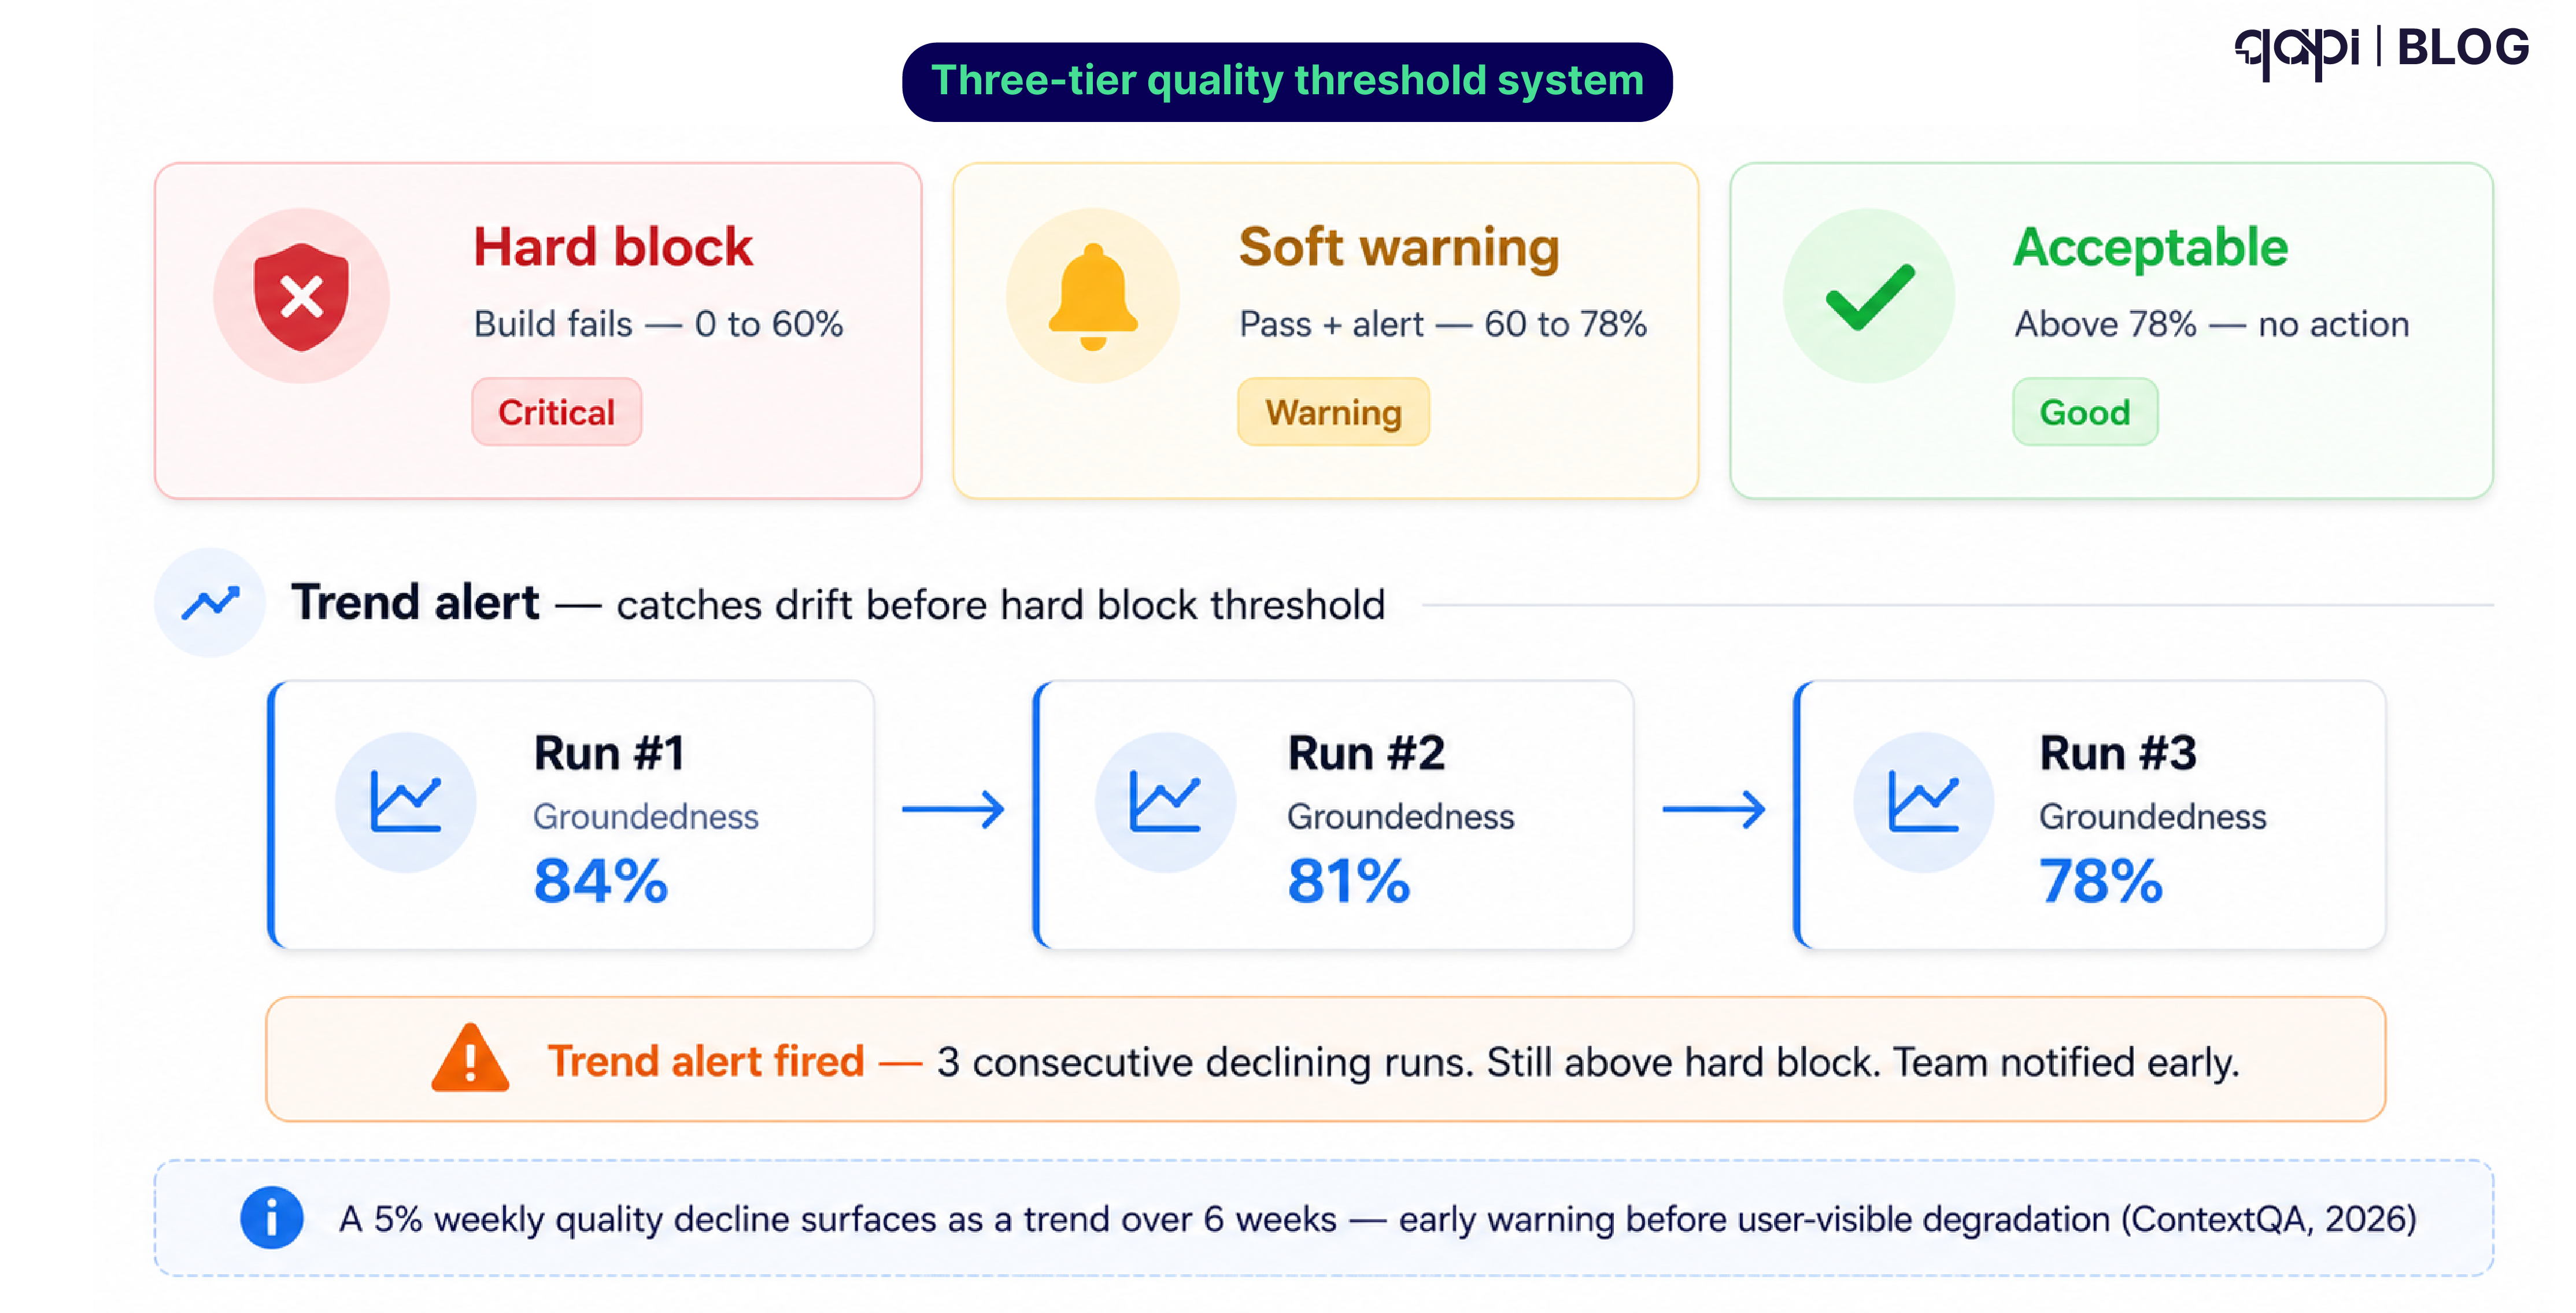
Tiered thresholds work better than single thresholds in practice.
• Hard block: Build fails completely. Reserve this for catastrophic failures — hallucination rate above 20%, or faithfulness below 0.60 on a medical or legal system.
• Soft warning: Build passes but the team is alerted. Use this for scores in a warning range — not failing, but worth reviewing.
• Trend alert: Scores are within acceptable range this run but have declined for three consecutive runs.
The trend alert is the one most teams skip and most teams later regret. A 2026 analysis by ContextQA found that a 5% weekly quality decline reveals itself as a trend over six weeks — early warning before it becomes a user-visible degradation event. A point-in-time threshold wouldn’t catch it. A trend alert would.
Step 5: Wire It Into Your Pipeline
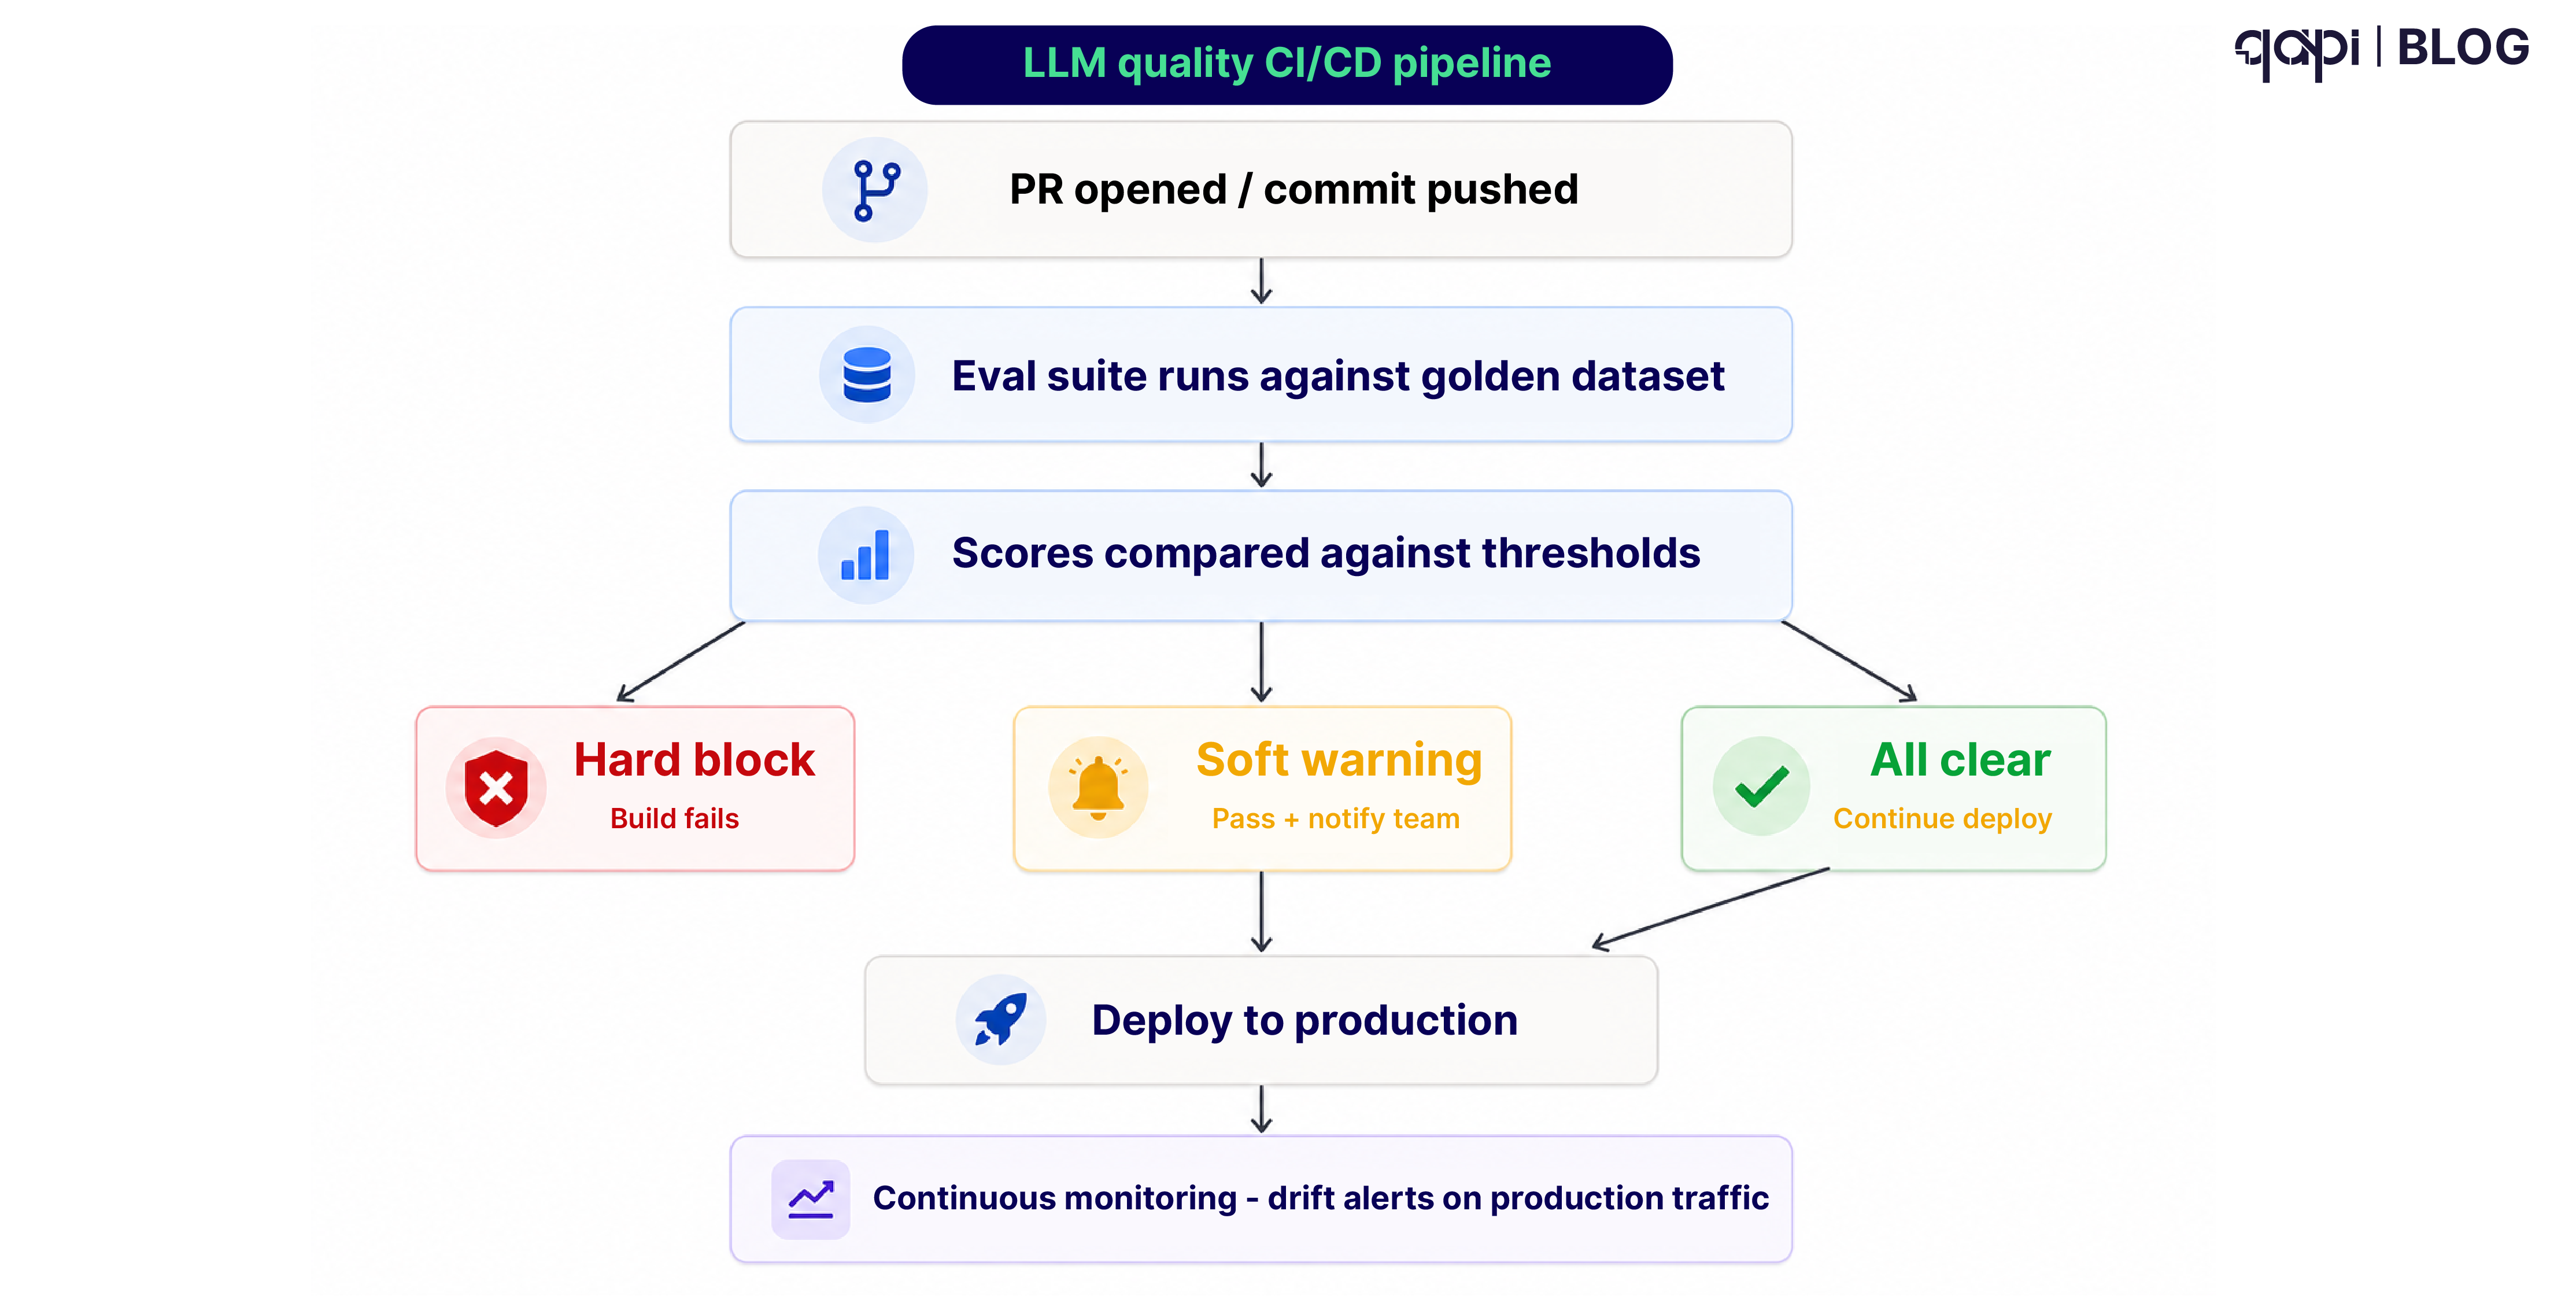
The pipeline structure is straightforward once steps 1–4 are done:
PR opened / commit pushed
↓
Run eval suite against golden dataset
↓
Score outputs (faithfulness, relevancy, groundedness)
↓
Compare scores against thresholds
↓
Hard block? → Fail build, surface results
Soft warning? → Pass build, notify team
All clear? → Continue to deployment
↓
Post-deployment: continuous monitoring against production traffic
GitHub Actions: Add the eval run as a workflow step. The eval suite produces a result artifact — metric scores and a pass/fail determination. The workflow branches based on that artifact.
Jenkins / GitLab CI: Same structure. The key integration point is publishing the eval results as a build artifact and using exit codes to signal pass/fail to the pipeline orchestrator.
One critical design constraint the Galtea guide flags clearly: the pipeline needs to track trends rather than point scores, catch regressions in aggregate rather than single-case failures, and route borderline cases to human review rather than treating them as hard blocks. An eval run that scores 0.76 faithfulness on one query out of 200 is not the same failure as a run where 60% of queries score below 0.76. Aggregate, don’t fail on individual query results.
Step 6: The Two Failure Modes Nobody Prepares For
Prompt Drift
A prompt change looks like an improvement on the tested examples. It ships. Two weeks later, it’s failing on a query category that wasn’t in the test set.
The Agenta CI/CD guide for LLM prompts identifies this pattern explicitly: in most organizations, a prompt change means editing a string in the codebase and deploying the whole application. Or worse, someone pastes a new prompt into a config file and pushes straight to main. Changes are deployed by gut feel.
The fix is treating prompt versions with the same versioning discipline as code. Every prompt change creates a versioned artifact. The eval suite runs against the new prompt version on the full golden dataset before it reaches production. Regression against the previous version’s scores catches cases where the new prompt improved some query categories while degrading others.
Silent Model Updates
Model providers update their underlying models without always announcing it. A model that scored 0.89 groundedness in March might score 0.81 in June — not because your code changed, but because the model serving that endpoint changed.
A 2024 study by Chen et al. tracked the behavior of GPT-3.5 and GPT-4 across six months and found statistically significant shifts in output distributions across multiple tasks — with no corresponding announcements from the provider. Teams relying on pre-deployment evaluation alone would have no visibility into these shifts.
The only way to catch this is continuous production monitoring: running your eval suite against a sample of real production traffic on a schedule, not just on deployments. This turns your evaluation pipeline from a deployment gate into an ongoing quality monitor.
Step 7: When the Pipeline Catches Something
A failing eval run is not a crisis. It’s the system working. The workflow when a build fails:
Look at which queries failed, not just the aggregate score. A drop in average faithfulness could mean a few specific query types are now failing badly. Identifying the pattern is faster than debugging the overall score.
Check what changed. Was there a prompt change, a model version change, a retrieval configuration change, or an API schema change upstream? The ContextQA 2026 guide is clear on this: RAG applications have two independent failure modes. Testing only the combined pipeline tells you whether the end result is good. Testing each layer separately tells you which one to fix.
Compare side by side with the previous run. Which query types improved, which degraded? A prompt change that improves 80% of query types while degrading 20% is different from one that improves 20% and degrades 80%.
Don’t lower the threshold to make the build pass. This is the failure mode that gradually erodes the value of the entire evaluation pipeline. Thresholds exist to catch real problems. If the build is failing, fix the quality issue.
What qAPI Adds to This Pipeline
Building all of this from scratch — dataset management, metric scoring, CI integration, reporting, production monitoring — takes significant engineering time. Most teams that build it themselves spend more time maintaining the evaluation infrastructure than using the results.
qAPI’s LLM Evaluator replaces that homegrown stack. You connect your model endpoint, import your golden dataset or let qAPI generate a starter set from your production queries, set your thresholds, and wire into your CI/CD pipeline.
What’s different from rolling your own:
The API testing layer is included. When a retrieval API changes its response structure and causes a quality drop, that shows up in qAPI as an API test failure alongside the LLM eval failure — in the same report. You don’t need to separately instrument your API layer.
Production monitoring doesn’t require a separate tool. The same platform that runs your CI quality gates also monitors production traffic on a schedule. Trend alerts surface when scores are declining across consecutive runs.
Team-shareable reporting. The eval results aren’t pytest output that only engineers can parse. They’re a shareable report where QA leads see the validation trace, product managers see the quality summary, and engineering leads see the metric trends — all from the same run.
The Practical Roadmap
The teams that successfully implement LLM CI/CD do it in stages:
Week 1–2: Define your critical prompt paths and build a starter golden dataset. Even 30–50 high-quality examples is enough to start. This is the slowest week because it requires human judgment.
Week 3: Set up your evaluation metrics and calibrate them against human judgment on your specific task type. Verify 80%+ judge agreement before treating it as a gate.
Week 4: Wire the eval run into your CI pipeline with soft-warning thresholds only. Don’t block deployments yet — just collect data.
Week 5–6: Analyze the first few weeks of eval runs. Adjust thresholds based on observed score distributions.
Week 7: Promote critical-path metrics to hard-block status. You now have a functioning LLM quality gate.
Ongoing: Grow the golden dataset. Add every real-world failure mode as it surfaces. Raise thresholds as quality improves. Add production monitoring once the deployment gate is stable.
The teams that fail at this try to build the whole thing in week one. Starting small and hardening over time is the approach that actually ships.
The Bottom Line
An LLM CI/CD pipeline isn’t fundamentally different from any other software quality pipeline. The principles are identical: define expected behavior, measure it automatically, gate deployments on meeting the standard, monitor continuously in production.
The only difference is that LLM outputs are probabilistic, not deterministic. That changes the measurement methodology but not the engineering discipline.
If a prompt change can break production silently, it deserves the same pipeline scrutiny as a code change that breaks a unit test.